| Table of Contents |  | ||||
March 31, 2021 | |||||
| Schedule | Page | |||||||
| Key Financial Data | ||||||||
| Capital Analysis | ||||||||
| Portfolio Analysis | ||||||||
| Tenant Analysis | ||||||||
| Appendix | ||||||||
Consolidated Statements of Operations (In thousands, except per share data) (Unaudited) | | ||||
| Three Months Ended | ||||||||||||||||||||||||||||||||
| OPERATING RESULTS | 3/31/2021 | 12/31/2020 | 9/30/2020 | 6/30/2020 | 3/31/2020 | |||||||||||||||||||||||||||
| Real estate rental revenue | $ | 69,633 | $ | 71,229 | $ | 73,227 | $ | 72,870 | $ | 76,792 | ||||||||||||||||||||||
| Real estate expenses | (26,694) | (28,713) | (28,672) | (26,885) | (28,639) | |||||||||||||||||||||||||||
| 42,939 | 42,516 | 44,555 | 45,985 | 48,153 | ||||||||||||||||||||||||||||
| Real estate depreciation and amortization | (29,643) | (30,241) | (30,470) | (29,599) | (29,720) | |||||||||||||||||||||||||||
| Income from real estate | 13,296 | 12,275 | 14,085 | 16,386 | 18,433 | |||||||||||||||||||||||||||
| Interest expense | (10,123) | (8,998) | (8,711) | (8,751) | (10,845) | |||||||||||||||||||||||||||
| Loss on interest rate derivatives | — | (560) | — | — | — | |||||||||||||||||||||||||||
| Loss on sale of real estate | — | (7,470) | — | (7,539) | — | |||||||||||||||||||||||||||
| (Loss) gain on extinguishment of debt | — | (296) | — | (206) | 468 | |||||||||||||||||||||||||||
| Other income | 1,284 | — | — | — | — | |||||||||||||||||||||||||||
| General and administrative expenses | (5,604) | (5,988) | (6,330) | (5,296) | (6,337) | |||||||||||||||||||||||||||
| Net (loss) income | $ | (1,147) | $ | (11,037) | $ | (956) | $ | (5,406) | $ | 1,719 | ||||||||||||||||||||||
| Per Share Data: | ||||||||||||||||||||||||||||||||
| Net (loss) income | $ | (0.02) | $ | (0.13) | $ | (0.01) | $ | (0.07) | $ | 0.02 | ||||||||||||||||||||||
| Fully diluted weighted average shares outstanding | 84,413 | 82,962 | 82,186 | 82,153 | 82,287 | |||||||||||||||||||||||||||
| Percentage of Revenues: | ||||||||||||||||||||||||||||||||
| Real estate expenses | 38.3 | % | 40.3 | % | 39.2 | % | 36.9 | % | 37.3 | % | ||||||||||||||||||||||
| General and administrative expenses | 8.0 | % | 8.4 | % | 8.6 | % | 7.3 | % | 8.3 | % | ||||||||||||||||||||||
| Ratios: | ||||||||||||||||||||||||||||||||
| Adjusted EBITDA / Interest expense | 3.9 | x | 4.1 | x | 4.4 | x | 4.7 | x | 3.9 | x | ||||||||||||||||||||||
| Net (loss) income / Real estate rental revenue | (1.6) | % | (15.5) | % | (1.3) | % | (7.4) | % | 2.2 | % | ||||||||||||||||||||||
Consolidated Balance Sheets (In thousands, except per share data) (Unaudited) | | ||||
| 3/31/2021 | 12/31/2020 | 9/30/2020 | 6/30/2020 | 3/31/2020 | |||||||||||||||||||||||||
| Assets | |||||||||||||||||||||||||||||
| Land | $ | 551,578 | $ | 551,578 | $ | 574,025 | $ | 574,025 | $ | 574,025 | |||||||||||||||||||
| Income producing property | 2,443,104 | 2,432,039 | 2,497,017 | 2,467,629 | 2,444,525 | ||||||||||||||||||||||||
| 2,994,682 | 2,983,617 | 3,071,042 | 3,041,654 | 3,018,550 | |||||||||||||||||||||||||
| Accumulated depreciation and amortization | (775,691) | (749,014) | (772,482) | (745,692) | (719,446) | ||||||||||||||||||||||||
| Net income producing property | 2,218,991 | 2,234,603 | 2,298,560 | 2,295,962 | 2,299,104 | ||||||||||||||||||||||||
| Properties under development or held for future development | 30,840 | 37,615 | 77,481 | 89,166 | 89,791 | ||||||||||||||||||||||||
| Total real estate held for investment, net | 2,249,831 | 2,272,218 | 2,376,041 | 2,385,128 | 2,388,895 | ||||||||||||||||||||||||
| Investment in real estate held for sale, net | — | — | — | — | 57,028 | ||||||||||||||||||||||||
| Cash and cash equivalents | 3,017 | 7,700 | 3,814 | 7,971 | 20,601 | ||||||||||||||||||||||||
| Restricted cash | 576 | 603 | 615 | 630 | 634 | ||||||||||||||||||||||||
| Rents and other receivables | 59,396 | 58,257 | 67,628 | 67,026 | 64,617 | ||||||||||||||||||||||||
| Prepaid expenses and other assets | 67,216 | 71,040 | 84,174 | 81,967 | 84,722 | ||||||||||||||||||||||||
| Other assets related to properties sold or held for sale | — | — | — | — | 6,123 | ||||||||||||||||||||||||
| Total assets | $ | 2,380,036 | $ | 2,409,818 | $ | 2,532,272 | $ | 2,542,722 | $ | 2,622,620 | |||||||||||||||||||
| Liabilities | |||||||||||||||||||||||||||||
| Notes payable, net | $ | 945,634 | $ | 945,370 | $ | 897,443 | $ | 897,060 | $ | 997,075 | |||||||||||||||||||
| Line of credit | 33,000 | 42,000 | 186,000 | 181,000 | 148,000 | ||||||||||||||||||||||||
| Accounts payable and other liabilities | 60,339 | 58,773 | 99,388 | 93,192 | 98,966 | ||||||||||||||||||||||||
| Dividend payable | 25,424 | 25,361 | 24,767 | 24,760 | — | ||||||||||||||||||||||||
| Advance rents | 6,642 | 7,215 | 6,979 | 7,375 | 8,681 | ||||||||||||||||||||||||
| Tenant security deposits | 10,095 | 9,990 | 10,580 | 10,769 | 10,875 | ||||||||||||||||||||||||
| Other liabilities related to properties sold or held for sale | — | — | — | — | 875 | ||||||||||||||||||||||||
| Total liabilities | 1,081,134 | 1,088,709 | 1,225,157 | 1,214,156 | 1,264,472 | ||||||||||||||||||||||||
| Equity | |||||||||||||||||||||||||||||
| Preferred shares; $0.01 par value; 10,000 shares authorized | — | — | — | — | — | ||||||||||||||||||||||||
| Shares of beneficial interest, $0.01 par value; 150,000 shares authorized | 846 | 844 | 824 | 823 | 823 | ||||||||||||||||||||||||
| Additional paid-in capital | 1,651,680 | 1,649,366 | 1,601,160 | 1,598,620 | 1,596,242 | ||||||||||||||||||||||||
| Distributions in excess of net income | (325,469) | (298,860) | (262,435) | (236,673) | (206,506) | ||||||||||||||||||||||||
| Accumulated other comprehensive loss | (28,473) | (30,563) | (32,759) | (34,533) | (32,744) | ||||||||||||||||||||||||
| Total shareholders' equity | 1,298,584 | 1,320,787 | 1,306,790 | 1,328,237 | 1,357,815 | ||||||||||||||||||||||||
| Noncontrolling interests in subsidiaries | 318 | 322 | 325 | 329 | 333 | ||||||||||||||||||||||||
| Total equity | 1,298,902 | 1,321,109 | 1,307,115 | 1,328,566 | 1,358,148 | ||||||||||||||||||||||||
| Total liabilities and equity | $ | 2,380,036 | $ | 2,409,818 | $ | 2,532,272 | $ | 2,542,722 | $ | 2,622,620 | |||||||||||||||||||
Funds from Operations (In thousands, except per share data) (Unaudited) | | ||||
| Three Months Ended | ||||||||||||||||||||||||||||||||
| 3/31/2021 | 12/31/2020 | 9/30/2020 | 6/30/2020 | 3/31/2020 | ||||||||||||||||||||||||||||
Funds from operations (FFO) (1) | ||||||||||||||||||||||||||||||||
| Net (loss) income | $ | (1,147) | $ | (11,037) | $ | (956) | $ | (5,406) | $ | 1,719 | ||||||||||||||||||||||
| Real estate depreciation and amortization | 29,643 | 30,241 | 30,470 | 29,599 | 29,720 | |||||||||||||||||||||||||||
| Loss on sale of depreciable real estate | — | 7,470 | — | 7,539 | — | |||||||||||||||||||||||||||
| NAREIT funds from operations (FFO) | 28,496 | 26,674 | 29,514 | 31,732 | 31,439 | |||||||||||||||||||||||||||
| Loss (gain) on extinguishment of debt | — | 296 | — | 206 | (468) | |||||||||||||||||||||||||||
| Loss on interest rate derivatives | — | 560 | — | — | — | |||||||||||||||||||||||||||
| Severance expense | 173 | — | — | — | — | |||||||||||||||||||||||||||
Core FFO (1) | $ | 28,669 | $ | 27,530 | $ | 29,514 | $ | 31,938 | $ | 30,971 | ||||||||||||||||||||||
Allocation to participating securities (2) | (139) | (92) | (151) | (151) | (151) | |||||||||||||||||||||||||||
| NAREIT FFO per share - basic | $ | 0.34 | $ | 0.32 | $ | 0.36 | $ | 0.38 | $ | 0.38 | ||||||||||||||||||||||
| NAREIT FFO per share - fully diluted | $ | 0.34 | $ | 0.32 | $ | 0.36 | $ | 0.38 | $ | 0.38 | ||||||||||||||||||||||
| Core FFO per share - fully diluted | $ | 0.34 | $ | 0.33 | $ | 0.36 | $ | 0.39 | $ | 0.37 | ||||||||||||||||||||||
| Common dividend per share | $ | 0.30 | $ | 0.30 | $ | 0.30 | $ | 0.30 | $ | 0.30 | ||||||||||||||||||||||
| Average shares - basic | 84,413 | 82,962 | 82,186 | 82,153 | 82,086 | |||||||||||||||||||||||||||
| Average shares - fully diluted (for NAREIT FFO and Core FFO) | 84,495 | 83,093 | 82,357 | 82,323 | 82,287 | |||||||||||||||||||||||||||
______________________________ | ||||||||||||||||||||||||||||||||
(1) See "Supplemental Definitions" on page 31 of this supplemental for the definitions of NAREIT FFO and Core FFO. | ||||||||||||||||||||||||||||||||
(2) Adjustment to the numerators for FFO and Core FFO per share calculations when applying the two-class method for calculating EPS. | ||||||||||||||||||||||||||||||||
Funds Available for Distribution (In thousands, except per share data) (Unaudited) | | ||||
| Three Months Ended | ||||||||||||||||||||||||||||||||
| 3/31/2021 | 12/31/2020 | 9/30/2020 | 6/30/2020 | 3/31/2020 | ||||||||||||||||||||||||||||
Funds available for distribution (FAD) (1) | ||||||||||||||||||||||||||||||||
| NAREIT FFO | $ | 28,496 | $ | 26,674 | $ | 29,514 | $ | 31,732 | $ | 31,439 | ||||||||||||||||||||||
| Non-cash loss (gain) on extinguishment of debt | — | 296 | — | 204 | (1,381) | |||||||||||||||||||||||||||
| Tenant improvements and incentives, net of reimbursements | 539 | (6,250) | (4,013) | (1,877) | (1,072) | |||||||||||||||||||||||||||
| External and internal leasing commissions capitalized | (538) | (1,445) | (1,081) | (797) | (529) | |||||||||||||||||||||||||||
| Recurring capital improvements | (867) | (2,164) | (1,068) | (824) | (988) | |||||||||||||||||||||||||||
| Straight-line rent, net | (548) | 82 | (522) | (655) | (663) | |||||||||||||||||||||||||||
| Non-cash fair value interest expense | — | — | — | — | (59) | |||||||||||||||||||||||||||
| Non-real estate depreciation and amortization of debt costs | 1,344 | 987 | 956 | 910 | 942 | |||||||||||||||||||||||||||
| Amortization of lease intangibles, net | 377 | 477 | 464 | 544 | 457 | |||||||||||||||||||||||||||
| Amortization and expensing of restricted share and unit compensation | 1,664 | 1,972 | 2,479 | 1,644 | 1,778 | |||||||||||||||||||||||||||
| FAD | 30,467 | 20,629 | 26,729 | 30,881 | 29,924 | |||||||||||||||||||||||||||
| Cash loss on extinguishment of debt | — | — | — | 2 | 913 | |||||||||||||||||||||||||||
| Loss on interest rate derivatives | — | 560 | — | — | — | |||||||||||||||||||||||||||
| Non-share-based severance expense | 103 | — | — | — | — | |||||||||||||||||||||||||||
Core FAD (1) | $ | 30,570 | $ | 21,189 | $ | 26,729 | $ | 30,883 | $ | 30,837 | ||||||||||||||||||||||
______________________________ | ||||||||||||||||||||||||||||||||
(1) See "Supplemental Definitions" on page 31 of this supplemental for the definitions of FAD and Core FAD. | ||||||||||||||||||||||||||||||||
Adjusted Earnings Before Interest, Taxes, Depreciation and Amortization (EBITDA) (In thousands) (Unaudited) | | ||||
| Three Months Ended | ||||||||||||||||||||||||||||||||
| 3/31/2021 | 12/31/2020 | 9/30/2020 | 6/30/2020 | 3/31/2020 | ||||||||||||||||||||||||||||
Adjusted EBITDA (1) | ||||||||||||||||||||||||||||||||
| Net (loss) income | $ | (1,147) | $ | (11,037) | $ | (956) | $ | (5,406) | $ | 1,719 | ||||||||||||||||||||||
| Add/(deduct): | ||||||||||||||||||||||||||||||||
| Interest expense | 10,123 | 8,998 | 8,711 | 8,751 | 10,845 | |||||||||||||||||||||||||||
| Real estate depreciation and amortization | 29,643 | 30,241 | 30,470 | 29,599 | 29,720 | |||||||||||||||||||||||||||
| Non-real estate depreciation | 233 | 229 | 234 | 241 | 238 | |||||||||||||||||||||||||||
| Severance expense | 173 | — | — | — | — | |||||||||||||||||||||||||||
| Loss on sale of depreciable real estate | — | 7,470 | — | 7,539 | — | |||||||||||||||||||||||||||
| Loss (gain) on extinguishment of debt | — | 296 | — | 206 | (468) | |||||||||||||||||||||||||||
| Loss on interest rate derivatives | — | 560 | — | — | — | |||||||||||||||||||||||||||
| Adjusted EBITDA | $ | 39,025 | $ | 36,757 | $ | 38,459 | $ | 40,930 | $ | 42,054 | ||||||||||||||||||||||
______________________________ | ||||||||||||||||||||||||||||||||
(1) Adjusted EBITDA is earnings before interest expense, taxes, depreciation, amortization, gain/loss on sale of real estate, casualty gain/loss, real estate impairment, gain/loss on extinguishment of debt, gain/loss on interest rate derivatives, severance expense, acquisition expenses, gain from non-disposal activities and loss/gain on interest rate derivatives. We consider Adjusted EBITDA to be an appropriate supplemental performance measure because it permits investors to view income from operations without the effect of depreciation, and the cost of debt or non-operating gains and losses. Adjusted EBITDA is a non-GAAP measure. | ||||||||||||||||||||||||||||||||
Long Term Debt Analysis ($'s in thousands) | | ||||
| 3/31/2021 | 12/31/2020 | 9/30/2020 | 6/30/2020 | 3/31/2020 | |||||||||||||||||||||||||
| Balances Outstanding | |||||||||||||||||||||||||||||
| Unsecured | |||||||||||||||||||||||||||||
| Fixed rate bonds | $ | 696,174 | $ | 695,968 | $ | 348,522 | $ | 348,375 | $ | 598,028 | |||||||||||||||||||
| Term loans | 249,460 | 249,402 | 548,921 | 548,685 | 399,047 | ||||||||||||||||||||||||
| Credit facility | 33,000 | 42,000 | 186,000 | 181,000 | 148,000 | ||||||||||||||||||||||||
| Unsecured total | 978,634 | 987,370 | 1,083,443 | 1,078,060 | 1,145,075 | ||||||||||||||||||||||||
| Total | $ | 978,634 | $ | 987,370 | $ | 1,083,443 | $ | 1,078,060 | $ | 1,145,075 | |||||||||||||||||||
| Weighted Average Interest Rates | |||||||||||||||||||||||||||||
| Unsecured | |||||||||||||||||||||||||||||
| Fixed rate bonds | 4.3 | % | 4.3 | % | 4.5 | % | 4.5 | % | 4.7 | % | |||||||||||||||||||
Term loans (1) | 2.9 | % | 2.9 | % | 2.6 | % | 2.6 | % | 2.8 | % | |||||||||||||||||||
| Credit facility | 1.1 | % | 1.1 | % | 1.1 | % | 1.2 | % | 1.8 | % | |||||||||||||||||||
| Unsecured total | 3.8 | % | 3.8 | % | 3.0 | % | 3.0 | % | 3.7 | % | |||||||||||||||||||
| Weighted Average | 3.8 | % | 3.8 | % | 3.0 | % | 3.0 | % | 3.7 | % | |||||||||||||||||||
______________________________ | |||||||||||||||||||||||||||||
(1) WashREIT entered into interest rate swaps to effectively fix the floating interest rates on its total $250.0 million aggregate principal of its term loans outstanding as of March 31, 2021 (see page 10 of this Supplemental). | |||||||||||||||||||||||||||||
Note: The current debt balances outstanding are shown net of discounts, premiums and unamortized debt costs (see page 10 of this Supplemental). | |||||||||||||||||||||||||||||
Long Term Debt Maturities (in thousands, except average interest rates) | | ||||
| March 31, 2021 | |||||
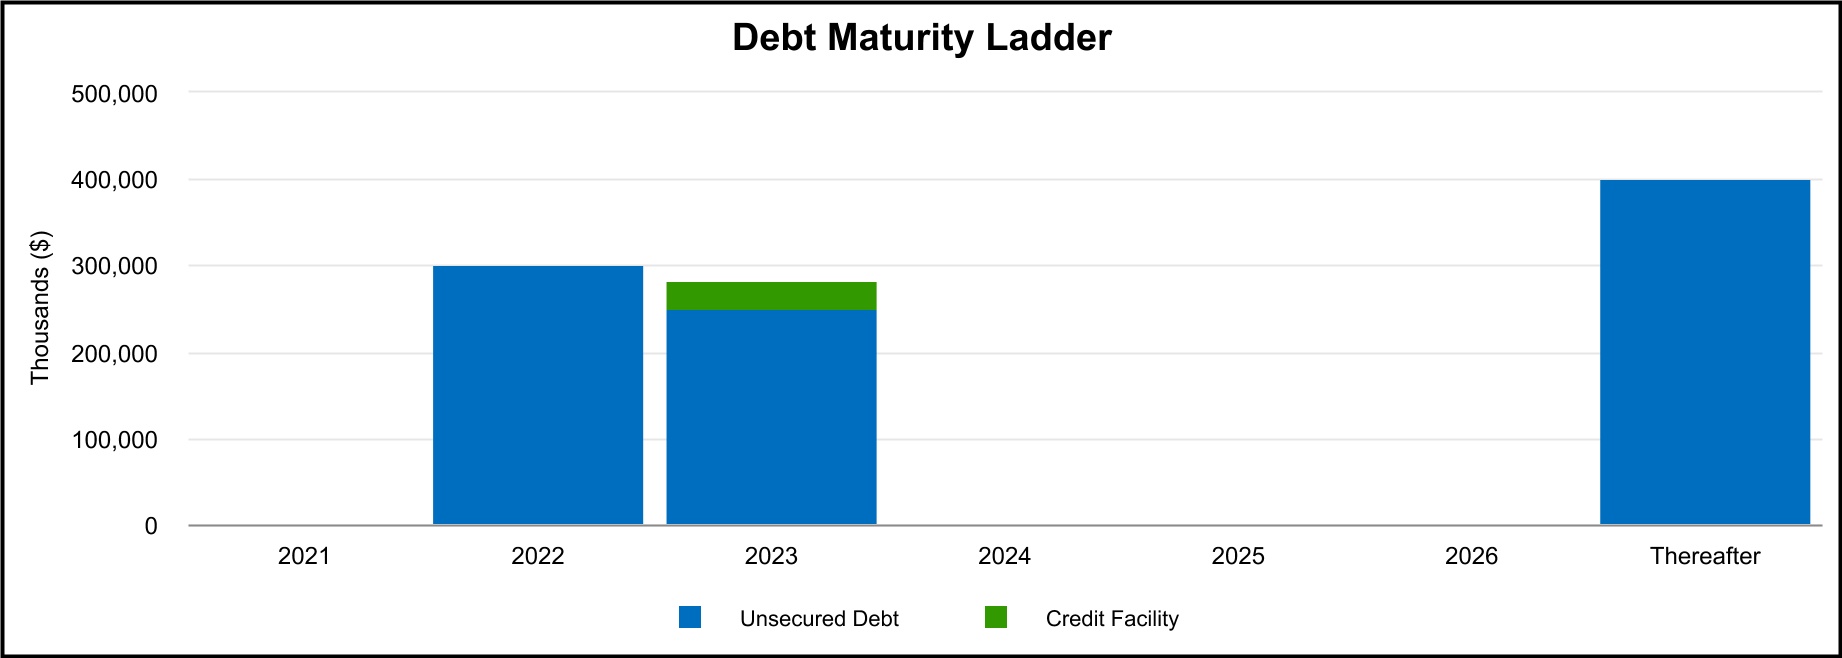
| Future Maturities of Debt | ||||||||||||||||||||||||||
| Year | Unsecured Debt | Credit Facility | Total Debt | Avg Interest Rate | ||||||||||||||||||||||
| 2021 | $ | — | $ | — | $ | — | —% | |||||||||||||||||||
| 2022 | 300,000 | — | 300,000 | 4.0% | ||||||||||||||||||||||
| 2023 | 250,000 | (1) | 33,000 | (2) | 283,000 | 2.7% | ||||||||||||||||||||
| 2024 | — | — | — | —% | ||||||||||||||||||||||
| 2025 | — | — | — | —% | ||||||||||||||||||||||
| 2026 | — | — | — | —% | ||||||||||||||||||||||
| Thereafter | 400,000 | (3) | — | 400,000 | 4.5% | |||||||||||||||||||||
| Scheduled principal payments | $ | 950,000 | $ | 33,000 | $ | 983,000 | 3.8% | |||||||||||||||||||
| Net discounts/premiums | (408) | — | (408) | |||||||||||||||||||||||
| Loan costs, net of amortization | (3,958) | — | (3,958) | |||||||||||||||||||||||
| Total maturities | $ | 945,634 | $ | 33,000 | $ | 978,634 | 3.8% | |||||||||||||||||||
Debt Covenant Compliance | | ||||
| Unsecured Public Debt Covenants | Unsecured Private Debt Covenants | ||||||||||||||||||||||||||||||||||
| Notes Payable | Line of Credit and Term Loans | Notes Payable | |||||||||||||||||||||||||||||||||
| Quarter Ended March 31, 2021 | Covenant | Quarter Ended March 31, 2021 | Covenant | Quarter Ended March 31, 2021 | Covenant | ||||||||||||||||||||||||||||||
% of Total Indebtedness to Total Assets(1) | 38.4 | % | ≤ 65.0% | N/A | N/A | N/A | N/A | ||||||||||||||||||||||||||||
| Ratio of Income Available for Debt Service to Annual Debt Service | 4.0 | ≥ 1.5 | N/A | N/A | N/A | N/A | |||||||||||||||||||||||||||||
% of Secured Indebtedness to Total Assets(1) | — | % | ≤ 40.0% | N/A | N/A | N/A | N/A | ||||||||||||||||||||||||||||
Ratio of Total Unencumbered Assets(2) to Total Unsecured Indebtedness | 2.6 | ≥ 1.5 | N/A | N/A | N/A | N/A | |||||||||||||||||||||||||||||
% of Net Consolidated Total Indebtedness to Consolidated Total Asset Value(3) | N/A | N/A | 32.7 | % | ≤ 60.0% | 32.7 | % | ≤ 60.0% | |||||||||||||||||||||||||||
Ratio of Consolidated Adjusted EBITDA(4) to Consolidated Fixed Charges(5) | N/A | N/A | 4.17 | ≥ 1.50 | 4.17 | ≥ 1.50 | |||||||||||||||||||||||||||||
% of Consolidated Secured Indebtedness to Consolidated Total Asset Value(3) | N/A | N/A | — | % | ≤ 40.0% | — | % | ≤ 40.0% | |||||||||||||||||||||||||||
% of Consolidated Unsecured Indebtedness to Unencumbered Pool Value(6) | N/A | N/A | 32.7 | % | ≤ 60.0% | 32.7 | % | ≤ 60.0% | |||||||||||||||||||||||||||
| Ratio of Unencumbered Adjusted Net Operating Income to Consolidated Unsecured Interest Expense | N/A | N/A | 4.59 | ≥ 1.75 | 4.59 | ≥ 1.75 | |||||||||||||||||||||||||||||
______________________________ | |||||||||||||||||||||||||||||||||||
(1) Total Assets is calculated by applying a capitalization rate of 7.50% to the EBITDA(4) from the last four consecutive quarters, excluding EBITDA from acquired, disposed, and non-stabilized development properties. | |||||||||||||||||||||||||||||||||||
(2) Total Unencumbered Assets is calculated by applying a capitalization rate of 7.50% to the EBITDA(4) from unencumbered properties from the last four consecutive quarters, excluding EBITDA from acquired, disposed, and non-stabilized development properties. | |||||||||||||||||||||||||||||||||||
(3) Consolidated Total Asset Value is the sum of unrestricted cash plus the quotient of applying a capitalization rate to the annualized NOI from the most recently ended quarter for each asset class, excluding NOI from disposed properties, acquisitions during the past 6 quarters, development, major redevelopment and low occupancy properties. To this amount, we add the purchase price of acquisitions during the past 6 quarters plus values for development, major redevelopment and low occupancy properties. | |||||||||||||||||||||||||||||||||||
(4) Consolidated Adjusted EBITDA is defined as earnings before noncontrolling interests, depreciation, amortization, interest expense, income tax expense, acquisition costs, extraordinary, unusual or nonrecurring transactions including sale of assets, impairment, gains and losses on extinguishment of debt and other non-cash charges. | |||||||||||||||||||||||||||||||||||
(5) Consolidated Fixed Charges consist of interest expense excluding capitalized interest and amortization of deferred financing costs, principal payments and preferred dividends, if any. | |||||||||||||||||||||||||||||||||||
(6) Unencumbered Pool Value is the sum of unrestricted cash plus the quotient of applying a capitalization rate to the annualized NOI from unencumbered properties from the most recently ended quarter for each asset class excluding NOI from disposed properties, acquisitions during the past 6 quarters, development, major redevelopment and low occupancy properties. To this we add the purchase price of unencumbered acquisitions during the past 6 quarters and values for unencumbered development, major redevelopment and low occupancy properties. | |||||||||||||||||||||||||||||||||||
Capital Analysis (In thousands, except per share amounts) | | ||||
| Three Months Ended | ||||||||||||||||||||||||||||||||
| 3/31/2021 | 12/31/2020 | 9/30/2020 | 6/30/2020 | 3/31/2020 | ||||||||||||||||||||||||||||
| Market Data | ||||||||||||||||||||||||||||||||
| Shares Outstanding | 84,564 | 84,409 | 82,351 | 82,327 | 82,315 | |||||||||||||||||||||||||||
| Market Price per Share | $ | 22.10 | $ | 21.63 | $ | 20.13 | $ | 22.20 | $ | 23.87 | ||||||||||||||||||||||
| Equity Market Capitalization | $ | 1,868,864 | $ | 1,825,767 | $ | 1,657,726 | $ | 1,827,659 | $ | 1,964,859 | ||||||||||||||||||||||
| Total Debt | $ | 978,634 | $ | 987,370 | $ | 1,083,443 | $ | 1,078,060 | $ | 1,145,075 | ||||||||||||||||||||||
| Total Market Capitalization | $ | 2,847,498 | $ | 2,813,137 | $ | 2,741,169 | $ | 2,905,719 | $ | 3,109,934 | ||||||||||||||||||||||
| Total Debt to Market Capitalization | 0.34 | :1 | 0.35 | :1 | 0.40 | :1 | 0.37 | :1 | 0.37 | :1 | ||||||||||||||||||||||
Earnings to Fixed Charges(1) | 0.9x | -0.2x | 0.8x | 0.4x | 1.1x | |||||||||||||||||||||||||||
Debt Service Coverage Ratio(2) | 3.9x | 4.1x | 4.4x | 4.7x | 3.9x | |||||||||||||||||||||||||||
| Dividend Data | Three Months Ended | |||||||||||||||||||||||||||||||
| 3/31/2021 | 12/31/2020 | 9/30/2020 | 6/30/2020 | 3/31/2020 | ||||||||||||||||||||||||||||
| Total Dividends Declared | $ | 25,462 | $ | 25,388 | $ | 24,806 | $ | 24,761 | $ | 24,820 | ||||||||||||||||||||||
| Common Dividend Declared per Share | $ | 0.30 | $ | 0.30 | $ | 0.30 | $ | 0.30 | $ | 0.30 | ||||||||||||||||||||||
| Payout Ratio (Core FFO basis) | 88.2 | % | 90.9 | % | 83.3 | % | 76.9 | % | 81.1 | % | ||||||||||||||||||||||
| Payout Ratio (Core FAD basis) | 83.3 | % | 81.1 | % | ||||||||||||||||||||||||||||
______________________________ | ||||||||||||||||||||||||||||||||
(1) The ratio of earnings to fixed charges is computed by dividing earnings by fixed charges. For this purpose, earnings consist of income from continuing operations attributable to the controlling interests plus fixed charges, less capitalized interest. Fixed charges consist of interest expense, including amortized costs of debt issuance, plus interest costs capitalized. The earnings to fixed charges ratio includes (loss) gain on sale of real estate of ($15.0 million) and ($7.5 million) for the three months ended December 31, 2020 and June 30, 2020, respectively. | ||||||||||||||||||||||||||||||||
(2) Debt service coverage ratio is computed by dividing Adjusted EBITDA (see page 8) by interest expense and principal amortization. | ||||||||||||||||||||||||||||||||
Same-Store Portfolio Net Operating Income (NOI) Growth 2021 vs. 2020 | | ||||
| Three Months Ended March 31, | ||||||||||||||||||||||||||
| 2021 | 2020 | % Change | ||||||||||||||||||||||||
| Cash Basis: | ||||||||||||||||||||||||||
| Multifamily | $ | 20,756 | $ | 22,809 | (9.0) | % | ||||||||||||||||||||
| Office | 18,386 | 19,292 | (4.7) | % | ||||||||||||||||||||||
Other (2) | 3,370 | 3,115 | 8.2 | % | ||||||||||||||||||||||
Overall Same-Store Portfolio (1) | $ | 42,512 | $ | 45,216 | (6.0) | % | ||||||||||||||||||||
| GAAP Basis: | ||||||||||||||||||||||||||
| Multifamily | $ | 20,751 | $ | 22,803 | (9.0) | % | ||||||||||||||||||||
| Office | 18,482 | 19,690 | (6.1) | % | ||||||||||||||||||||||
Other (2) | 3,497 | 3,207 | 9.0 | % | ||||||||||||||||||||||
Overall Same-Store Portfolio (1) | $ | 42,730 | $ | 45,700 | (6.5) | % | ||||||||||||||||||||
______________________________ | ||
(1) Non same-store properties were: | ||
| Development: | ||
| Multifamily - Trove | ||
| Sold properties: | ||
| Office - John Marshall II, Monument II and 1227 25th Street | ||
(2) Consists of retail centers: Takoma Park, Westminster, Concord Centre, Chevy Chase Metro Plaza, 800 S. Washington Street, Randolph Shopping Center, Montrose Shopping Center and Spring Valley Village. | ||
Same-Store Portfolio Net Operating Income (NOI) Detail (In thousands) | | ||||
| Three Months Ended March 31, 2021 | |||||||||||||||||||||||
| Multifamily | Office | Corporate and Other (1) | Total | ||||||||||||||||||||
| Real estate rental revenue | |||||||||||||||||||||||
| Same-store portfolio | $ | 35,156 | $ | 28,599 | $ | 4,902 | $ | 68,657 | |||||||||||||||
Non same-store (1) | 976 | — | — | 976 | |||||||||||||||||||
| Total | 36,132 | 28,599 | 4,902 | 69,633 | |||||||||||||||||||
| Real estate expenses | |||||||||||||||||||||||
| Same-store portfolio | 14,405 | 10,117 | 1,405 | 25,927 | |||||||||||||||||||
Non same-store (1) | 767 | — | — | 767 | |||||||||||||||||||
| Total | 15,172 | 10,117 | 1,405 | 26,694 | |||||||||||||||||||
| Net Operating Income (NOI) | |||||||||||||||||||||||
| Same-store portfolio | 20,751 | 18,482 | 3,497 | 42,730 | |||||||||||||||||||
Non same-store (1) | 209 | — | — | 209 | |||||||||||||||||||
| Total | $ | 20,960 | $ | 18,482 | $ | 3,497 | $ | 42,939 | |||||||||||||||
| Same-store portfolio NOI (from above) | $ | 20,751 | $ | 18,482 | $ | 3,497 | $ | 42,730 | |||||||||||||||
| Straight-line revenue, net for same-store properties | 4 | (534) | (18) | (548) | |||||||||||||||||||
| Amortization of acquired lease assets (liabilities) for same-store properties | 1 | 40 | (126) | (85) | |||||||||||||||||||
| Amortization of lease intangibles for same-store properties | — | 398 | 17 | 415 | |||||||||||||||||||
| Same-store portfolio cash NOI | $ | 20,756 | $ | 18,386 | $ | 3,370 | $ | 42,512 | |||||||||||||||
| Reconciliation of NOI to net income | |||||||||||||||||||||||
| Total NOI | $ | 20,960 | $ | 18,482 | $ | 3,497 | $ | 42,939 | |||||||||||||||
| Depreciation and amortization | (14,978) | (13,230) | (1,435) | (29,643) | |||||||||||||||||||
| General and administrative expenses | — | — | (5,604) | (5,604) | |||||||||||||||||||
| Interest expense | — | — | (10,123) | (10,123) | |||||||||||||||||||
| Other income | — | — | 1,284 | 1,284 | |||||||||||||||||||
| Net income (loss) | $ | 5,982 | $ | 5,252 | $ | (12,381) | $ | (1,147) | |||||||||||||||
______________________________ | |||||||||||||||||||||||
(1) For a list of non-same-store and other properties, see page 13 of this Supplemental. | |||||||||||||||||||||||
Same-Store Portfolio Net Operating Income (NOI) Detail (In thousands) | | ||||
| Three Months Ended December 31, 2020 | |||||||||||||||||||||||
| Multifamily | Office | Corporate and Other (1) | Total | ||||||||||||||||||||
| Real estate rental revenue | |||||||||||||||||||||||
| Same-store portfolio | $ | 35,465 | $ | 28,980 | $ | 3,902 | $ | 68,347 | |||||||||||||||
Non same-store (1) | 698 | 2,184 | — | 2,882 | |||||||||||||||||||
| Total | 36,163 | 31,164 | 3,902 | 71,229 | |||||||||||||||||||
| Real estate expenses | |||||||||||||||||||||||
| Same-store portfolio | 14,304 | 11,300 | 1,405 | 27,009 | |||||||||||||||||||
Non same-store (1) | 728 | 976 | — | 1,704 | |||||||||||||||||||
| Total | 15,032 | 12,276 | 1,405 | 28,713 | |||||||||||||||||||
| Net Operating Income (NOI) | |||||||||||||||||||||||
| Same-store portfolio | 21,161 | 17,680 | 2,497 | 41,338 | |||||||||||||||||||
Non same-store (1) | (30) | 1,208 | — | 1,178 | |||||||||||||||||||
| Total | $ | 21,131 | $ | 18,888 | $ | 2,497 | $ | 42,516 | |||||||||||||||
| Same-store portfolio NOI (from above) | $ | 21,161 | $ | 17,680 | $ | 2,497 | $ | 41,338 | |||||||||||||||
| Straight-line revenue, net for same-store properties | 4 | (567) | 16 | (547) | |||||||||||||||||||
| Amortization of acquired lease assets (liabilities) for same-store properties | 1 | 42 | (126) | (83) | |||||||||||||||||||
| Amortization of lease intangibles for same-store properties | — | 331 | 17 | 348 | |||||||||||||||||||
| Same-store portfolio cash NOI | $ | 21,166 | $ | 17,486 | $ | 2,404 | $ | 41,056 | |||||||||||||||
| Reconciliation of NOI to net income | |||||||||||||||||||||||
| Total NOI | $ | 21,131 | $ | 18,888 | $ | 2,497 | $ | 42,516 | |||||||||||||||
| Depreciation and amortization | (14,636) | (14,157) | (1,448) | (30,241) | |||||||||||||||||||
| General and administrative expenses | — | — | (5,988) | (5,988) | |||||||||||||||||||
| Interest expense | — | — | (8,998) | (8,998) | |||||||||||||||||||
| Loss on interest rate derivatives | — | — | (560) | (560) | |||||||||||||||||||
| Loss on sale of real estate | — | — | (7,470) | (7,470) | |||||||||||||||||||
| Loss on extinguishment of debt | — | — | (296) | (296) | |||||||||||||||||||
| Net income (loss) | $ | 6,495 | $ | 4,731 | $ | (22,263) | $ | (11,037) | |||||||||||||||
______________________________ | |||||||||||||||||||||||
(1) For a list of non-same-store, discontinued operations and other properties, see page 13 of this Supplemental. | |||||||||||||||||||||||
Same-Store Portfolio Net Operating Income (NOI) Detail (In thousands) | | ||||
| Three Months Ended March 31, 2020 | |||||||||||||||||||||||
| Multifamily | Office | Corporate and Other (1) | Total | ||||||||||||||||||||
| Real estate rental revenue | |||||||||||||||||||||||
| Same-store portfolio | $ | 36,541 | $ | 31,014 | $ | 4,544 | $ | 72,099 | |||||||||||||||
Non same-store (1) | 37 | 4,656 | — | 4,693 | |||||||||||||||||||
| Total | 36,578 | 35,670 | 4,544 | 76,792 | |||||||||||||||||||
| Real estate expenses | |||||||||||||||||||||||
| Same-store portfolio | 13,738 | 11,324 | 1,337 | 26,399 | |||||||||||||||||||
Non same-store (1) | 247 | 1,993 | — | 2,240 | |||||||||||||||||||
| Total | 13,985 | 13,317 | 1,337 | 28,639 | |||||||||||||||||||
| Net Operating Income (NOI) | |||||||||||||||||||||||
| Same-store portfolio | 22,803 | 19,690 | 3,207 | 45,700 | |||||||||||||||||||
Non same-store (1) | (210) | 2,663 | — | 2,453 | |||||||||||||||||||
| Total | $ | 22,593 | $ | 22,353 | $ | 3,207 | $ | 48,153 | |||||||||||||||
| Same-store portfolio NOI (from above) | $ | 22,803 | $ | 19,690 | $ | 3,207 | $ | 45,700 | |||||||||||||||
| Straight-line revenue, net for same-store properties | 5 | (734) | 18 | (711) | |||||||||||||||||||
| Amortization of acquired lease liabilities for same-store properties | 1 | (30) | (127) | (156) | |||||||||||||||||||
| Amortization of lease intangibles for same-store properties | — | 366 | 17 | 383 | |||||||||||||||||||
| Same-store portfolio cash NOI | $ | 22,809 | $ | 19,292 | $ | 3,115 | $ | 45,216 | |||||||||||||||
| Reconciliation of NOI to net income | |||||||||||||||||||||||
| Total NOI | $ | 22,593 | $ | 22,353 | $ | 3,207 | $ | 48,153 | |||||||||||||||
| Depreciation and amortization | (13,961) | (14,354) | (1,405) | (29,720) | |||||||||||||||||||
| General and administrative expenses | — | — | (6,337) | (6,337) | |||||||||||||||||||
| Interest expense | (172) | — | (10,673) | (10,845) | |||||||||||||||||||
| Loss on extinguishment of debt | — | — | 468 | 468 | |||||||||||||||||||
| Net income (loss) | $ | 8,460 | $ | 7,999 | (14,740) | $ | 1,719 | ||||||||||||||||
______________________________ | |||||||||||||||||||||||
(1) For a list of non-same-store, discontinued operations and other properties, see page 13 of this Supplemental. | |||||||||||||||||||||||
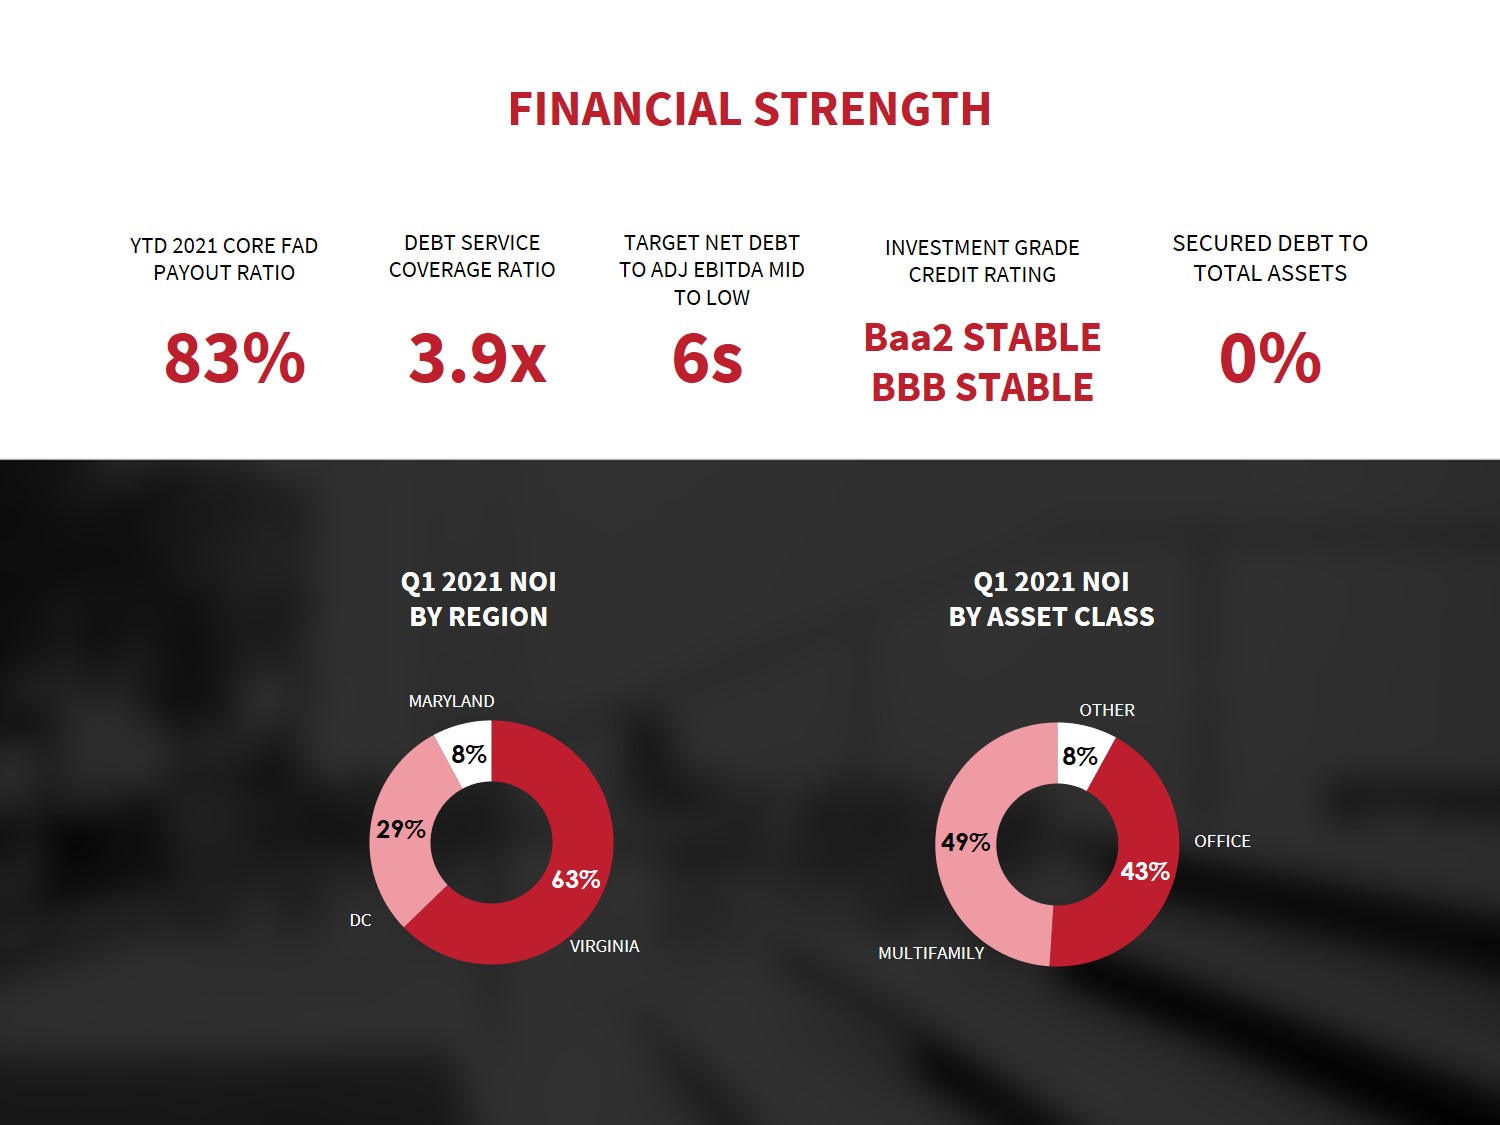
| Net Operating Income (NOI) by Region | | ||||
| Percentage of NOI | ||||||||||||||
| Q1 2021 | ||||||||||||||
| DC | ||||||||||||||
| Multifamily | 6.0 | % | ||||||||||||
| Office | 20.8 | % | ||||||||||||
| Other | 2.5 | % | ||||||||||||
| 29.3 | % | |||||||||||||
| Maryland | ||||||||||||||
| Multifamily | 4.2 | % | ||||||||||||
| Other | 3.7 | % | ||||||||||||
| 7.9 | % | |||||||||||||
| Virginia | ||||||||||||||
| Multifamily | 38.7 | % | ||||||||||||
| Office | 22.2 | % | ||||||||||||
| Other | 1.9 | % | ||||||||||||
| 62.8 | % | |||||||||||||
| Total Portfolio | 100.0 | % | ||||||||||||
Net Operating Income (NOI) - Multifamily (Dollars In thousands) | | ||||
| Apartment Units as of 03/31/2021 | Three Months Ended | ||||||||||||||||||||||||||||||||||
| 03/31/2021 | 12/31/2020 | 9/30/2020 | 6/30/2020 | 3/31/2020 | |||||||||||||||||||||||||||||||
| Rental and other property revenues | |||||||||||||||||||||||||||||||||||
Same-store (1) | 6,658 | $ | 35,156 | $ | 35,465 | $ | 35,821 | $ | 35,824 | $ | 36,541 | ||||||||||||||||||||||||
| Non same-store | |||||||||||||||||||||||||||||||||||
Development (2) | 401 | 976 | 698 | 445 | 214 | 37 | |||||||||||||||||||||||||||||
| Total rental and other property revenues | 7,059 | 36,132 | 36,163 | 36,266 | 36,038 | 36,578 | |||||||||||||||||||||||||||||
| Property operating expenses | |||||||||||||||||||||||||||||||||||
| Same-store | 14,405 | 14,304 | 14,532 | 13,806 | 13,738 | ||||||||||||||||||||||||||||||
| Non same-store | |||||||||||||||||||||||||||||||||||
| Development | 767 | 728 | 456 | 304 | 247 | ||||||||||||||||||||||||||||||
| Total property operating expenses | 15,172 | 15,032 | 14,988 | 14,110 | 13,985 | ||||||||||||||||||||||||||||||
| Net Operating Income (NOI) | |||||||||||||||||||||||||||||||||||
| Same-store | 20,751 | 21,161 | 21,289 | 22,018 | 22,803 | ||||||||||||||||||||||||||||||
| Non same-store | |||||||||||||||||||||||||||||||||||
| Development | 209 | (30) | (11) | (90) | (210) | ||||||||||||||||||||||||||||||
| Total NOI | $ | 20,960 | $ | 21,131 | $ | 21,278 | $ | 21,928 | $ | 22,593 | |||||||||||||||||||||||||
| Same-store metrics | |||||||||||||||||||||||||||||||||||
Retention (3) | 51 | % | 51 | % | 58 | % | 61 | % | 56 | % | |||||||||||||||||||||||||
Same-Store Operating Results - Multifamily (Dollars in thousands, except Average Effective Monthly Rent per Unit) | | ||||
| Rental and Other Property Revenue | Property Operating Expenses | Net Operating Income | Average Occupancy | Average Effective Monthly Rent per Unit | ||||||||||||||||||||||||||||||||||||||||||||||||||||||||||||||||||||||||||||||||||||||||||||||
| Quarter-to-Date Comparison | Apt Units | Q1 2021 | Q1 2020 | % Change | Q1 2021 | Q1 2020 | % Change | Q1 2021 | Q1 2020 | % Change | Q1 2021 | Q1 2020 | % Change | Q1 2021 | Q1 2020 | % Change | ||||||||||||||||||||||||||||||||||||||||||||||||||||||||||||||||||||||||||||||||||
| Total/Weighted Average | 6,658 | $ | 35,156 | $ | 36,541 | (3.8) | % | $ | 14,405 | $ | 13,738 | 4.9 | % | $ | 20,751 | $ | 22,803 | (9.0) | % | 94.3 | % | 95.4 | % | (1.2) | % | $ | 1,681 | $ | 1,734 | (3.1) | % | |||||||||||||||||||||||||||||||||||||||||||||||||||||||||||||||||||
| Rental and Other Property Revenue | Property Operating Expenses | Net Operating Income | Average Occupancy | Average Effective Monthly Rent per Unit | ||||||||||||||||||||||||||||||||||||||||||||||||||||||||||||||||||||||||||||||||||||||||||||||
| Sequential Comparison | Apt Units | Q1 2021 | Q4 2020 | % Change | Q1 2021 | Q4 2020 | % Change | Q1 2021 | Q4 2020 | % Change | Q1 2021 | Q4 2020 | % Change | Q1 2021 | Q4 2020 | % Change | ||||||||||||||||||||||||||||||||||||||||||||||||||||||||||||||||||||||||||||||||||
| Total/Weighted Average | 6,658 | $ | 35,156 | $ | 35,465 | (0.9) | % | $ | 14,405 | $ | 14,304 | 0.7 | % | $ | 20,751 | $ | 21,161 | (1.9) | % | 94.3 | % | 94.0 | % | 0.3 | % | $ | 1,681 | $ | 1,701 | (1.2) | % | |||||||||||||||||||||||||||||||||||||||||||||||||||||||||||||||||||
Same-Store Operating Expenses - Multifamily (In thousands) | | ||||
| Quarter-to-Date Comparison | Q1 2021 | Q1 2020 | $ Change | % Change | % of Q1 2021 Total | ||||||||||||||||||||||||
Controllable (1) | $ | 6,671 | $ | 6,307 | $ | 364 | 5.8 | % | 46.3 | % | |||||||||||||||||||
Non-Controllable (2) | 7,734 | 7,431 | 303 | 4.1 | % | 53.7 | % | ||||||||||||||||||||||
| Total same-store operating expenses | $ | 14,405 | $ | 13,738 | $ | 667 | 4.9 | % | 100.0 | % | |||||||||||||||||||
| Sequential Comparison | Q1 2021 | Q4 2020 | $ Change | % Change | % of Q1 2021 Total | ||||||||||||||||||||||||
| Controllable | $ | 6,671 | $ | 6,945 | $ | (274) | (3.9) | % | 46.3 | % | |||||||||||||||||||
| Non-Controllable | 7,734 | 7,359 | 375 | 5.1 | % | 53.7 | % | ||||||||||||||||||||||
| Total same-store operating expenses | $ | 14,405 | $ | 14,304 | $ | 101 | 0.7 | % | 100.0 | % | |||||||||||||||||||
______________________________ | ||
(1) Controllable operating expenses consist of: | ||
| Payroll, Repairs & Maintenance, Marketing, Administrative and other | ||
(2) Non-Controllable operating expenses consist of: | ||
| Third-party Fees, Utilities, Insurance and Real Estate Taxes | ||
| Same-Store Portfolio and Overall Average Occupancy Levels by Sector | | ||||
Average Occupancy - Same-Store Properties(1) (2) | ||||||||||||||||||||||||||||||||
| Sector | 03/31/2021 | 12/31/2020 | 09/30/2020 | 6/30/2020 | 3/31/2020 | |||||||||||||||||||||||||||
| Multifamily | 94.3 | % | 94.0 | % | 94.3 | % | 94.5 | % | 95.4 | % | ||||||||||||||||||||||
| Office | 84.2 | % | 85.6 | % | 86.1 | % | 86.0 | % | 86.7 | % | ||||||||||||||||||||||
Other (3) | 87.4 | % | 86.6 | % | 85.8 | % | 87.2 | % | 91.0 | % | ||||||||||||||||||||||
| Overall Portfolio | 91.1 | % | 91.1 | % | 91.4 | % | 91.5 | % | 92.6 | % | ||||||||||||||||||||||
Average Occupancy - All Properties (2) | ||||||||||||||||||||||||||||||||
| Sector | 3/31/2021 | 12/31/2020 | 9/30/2020 | 6/30/2020 | 3/31/2020 | |||||||||||||||||||||||||||
Multifamily (4) | 94.3 | % | 94.0 | % | 94.3 | % | 94.5 | % | 95.4 | % | ||||||||||||||||||||||
| Office | 84.2 | % | 86.0 | % | 86.5 | % | 86.8 | % | 88.1 | % | ||||||||||||||||||||||
Other (3) | 87.4 | % | 86.6 | % | 85.8 | % | 87.2 | % | 91.0 | % | ||||||||||||||||||||||
Overall Portfolio (4) | 91.1 | % | 91.1 | % | 91.3 | % | 91.5 | % | 92.7 | % | ||||||||||||||||||||||
______________________________ | ||
(1) Non same-store properties were: | ||
| Development: | ||
| Multifamily - Trove | ||
| Sold properties: | ||
| Office - John Marshall II, Monument II and 1227 25th Street | ||
(2) Average occupancy is based on monthly occupied net rentable square footage as a percentage of total net rentable square footage, except for the rows labeled "Multifamily," on which average occupancy is based on average monthly occupied units as a percentage of total units. The square footage for multifamily properties only includes residential space. The occupied square footage for office and other properties includes short-term lease agreements. | ||
(3) Consists of retail centers: Takoma Park, Westminster, Concord Centre, Chevy Chase Metro Plaza, 800 S. Washington Street, Randolph Shopping Center, Montrose Shopping Center and Spring Valley Village. | ||
(4) Average occupancy excludes the addition of the total rentable units at Trove, which began to lease-up in the first quarter of 2020. Including Trove, multifamily average occupancy was 91.1%, 90.2%, 89.9%, 89.5%, and 90.0% and overall portfolio average occupancy was 89.4%, 89.2%, 89.1%, 89.0% and 90.0% for each of the quarters ended March 31, 2021, December 31 2020, September 30, 2020, June 30, 2020 and March 31, 2020, respectively. | ||
| Same-Store Portfolio and Overall Ending Occupancy Levels by Sector | | ||||
Ending Occupancy - Same-Store Properties (1) (2) | ||||||||||||||||||||||||||||||||
| Sector | 3/31/2021 | 12/31/2020 | 9/30/2020 | 6/30/2020 | 3/31/2020 | |||||||||||||||||||||||||||
| Multifamily | 94.9 | % | 94.3 | % | 94.6 | % | 94.3 | % | 95.1 | % | ||||||||||||||||||||||
| Office | 83.3 | % | 85.7 | % | 86.0 | % | 86.4 | % | 86.8 | % | ||||||||||||||||||||||
Other (3) | 87.4 | % | 86.5 | % | 86.8 | % | 84.0 | % | 91.1 | % | ||||||||||||||||||||||
| Overall Portfolio | 90.9 | % | 91.4 | % | 91.6 | % | 91.8 | % | 92.4 | % | ||||||||||||||||||||||
Ending Occupancy - All Properties (2) | ||||||||||||||||||||||||||||||||
| Sector | 3/31/2021 | 12/31/2020 | 9/30/2020 | 6/30/2020 | 3/31/2020 | |||||||||||||||||||||||||||
Multifamily (4) | 94.9 | % | 94.3 | % | 94.6 | % | 94.3 | % | 95.1 | % | ||||||||||||||||||||||
| Office | 83.3 | % | 85.7 | % | 86.6 | % | 86.8 | % | 88.1 | % | ||||||||||||||||||||||
Other (3) | 87.4 | % | 86.5 | % | 86.8 | % | 84.0 | % | 91.1 | % | ||||||||||||||||||||||
Overall Portfolio (4) | 90.9 | % | 91.4 | % | 91.6 | % | 91.7 | % | 92.5 | % | ||||||||||||||||||||||
______________________________ | ||
(1) Non same-store properties were: | ||
| Development: | ||
| Multifamily - Trove | ||
| Sold properties: | ||
| Office - John Marshall II, Monument II and 1227 25th Street | ||
(2) Ending occupancy is calculated as occupied square footage as a percentage of total square footage as of the last day of that period, except for the rows labeled "Multifamily," on which ending occupancy is calculated as occupied units as a percentage of total available units as of the last day of that period. The occupied square footage for office and other properties includes short-term lease agreements. | ||
(3) Consists of retail centers: Takoma Park, Westminster, Concord Centre, Chevy Chase Metro Plaza, 800 S. Washington Street, Randolph Shopping Center, Montrose Shopping Center and Spring Valley Village. | ||
(4) Ending occupancy excludes the addition of the total rentable units at Trove, which began to lease-up in the first quarter of 2020. Including Trove, multifamily ending occupancy was 92.0%, 90.9%, 90.5%, 89.8%, and 89.9% and overall portfolio ending occupancy was 89.5%, 89.7%, 89.5%, 89.4% and 89.9% as of March 31 2021, December 31, 2020, September 30, 2020, June 30, 2020 and March 31, 2020, respectively. | ||
| Commercial Leasing Summary - New Leases | | ||||
| 1st Quarter 2021 | 4th Quarter 2020 | 3rd Quarter 2020 | 2nd Quarter 2020 | 1st Quarter 2020 | |||||||||||||||||||||||||||||||||||||||||||||||||||||||
| Gross Leasing Square Footage | |||||||||||||||||||||||||||||||||||||||||||||||||||||||||||
| Office Buildings | 29,065 | 9,437 | 19,159 | 19,795 | 45,976 | ||||||||||||||||||||||||||||||||||||||||||||||||||||||
| Retail Centers | — | 7,824 | 5,900 | 420 | 15,392 | ||||||||||||||||||||||||||||||||||||||||||||||||||||||
| Total | 29,065 | 17,261 | 25,059 | 20,215 | 61,368 | ||||||||||||||||||||||||||||||||||||||||||||||||||||||
| Weighted Average Term (years) | |||||||||||||||||||||||||||||||||||||||||||||||||||||||||||
| Office Buildings | 6.7 | 4.5 | 5.3 | 8.3 | 4.4 | ||||||||||||||||||||||||||||||||||||||||||||||||||||||
| Retail Centers | — | 5.5 | 12.1 | 5.0 | 5.5 | ||||||||||||||||||||||||||||||||||||||||||||||||||||||
| Total | 6.7 | 4.9 | 6.9 | 8.3 | 4.7 | ||||||||||||||||||||||||||||||||||||||||||||||||||||||
| Weighted Average Free Rent Period (months) | |||||||||||||||||||||||||||||||||||||||||||||||||||||||||||
| Office Buildings | 3.9 | 3.5 | 6.2 | 7.3 | 1.1 | ||||||||||||||||||||||||||||||||||||||||||||||||||||||
| Retail Centers | — | 1.8 | 5.2 | — | 1.1 | ||||||||||||||||||||||||||||||||||||||||||||||||||||||
| Total | 3.9 | 3.2 | 6.1 | 7.3 | 1.1 | ||||||||||||||||||||||||||||||||||||||||||||||||||||||
| Rental Rate Increases: | GAAP | CASH | GAAP | CASH | GAAP | CASH | GAAP | CASH | GAAP | CASH | |||||||||||||||||||||||||||||||||||||||||||||||||
| Rate on expiring leases | |||||||||||||||||||||||||||||||||||||||||||||||||||||||||||
| Office Buildings | $ | 55.80 | $ | 57.71 | $ | 48.83 | $ | 50.20 | $ | 41.57 | $ | 44.81 | $ | 54.47 | $ | 50.74 | $ | 43.39 | $ | 43.12 | |||||||||||||||||||||||||||||||||||||||
| Retail Centers | — | — | 12.59 | 14.79 | 18.87 | 16.11 | 15.93 | 15.00 | 17.96 | 17.90 | |||||||||||||||||||||||||||||||||||||||||||||||||
| Total | $ | 55.80 | $ | 57.71 | $ | 32.40 | $ | 34.15 | $ | 36.23 | $ | 38.06 | $ | 53.67 | $ | 50.00 | $ | 37.01 | $ | 36.80 | |||||||||||||||||||||||||||||||||||||||
| Rate on new leases | |||||||||||||||||||||||||||||||||||||||||||||||||||||||||||
| Office Buildings | $ | 58.22 | $ | 51.28 | $ | 46.32 | $ | 45.93 | $ | 45.74 | $ | 43.06 | $ | 54.89 | $ | 49.55 | $ | 47.20 | $ | 45.37 | |||||||||||||||||||||||||||||||||||||||
| Retail Centers | — | — | 14.22 | 14.79 | 18.87 | 16.10 | 15.93 | 15.00 | 21.31 | 19.36 | |||||||||||||||||||||||||||||||||||||||||||||||||
| Total | $ | 58.22 | $ | 51.28 | $ | 31.77 | $ | 31.81 | $ | 39.41 | $ | 36.72 | $ | 54.08 | $ | 48.83 | $ | 40.71 | $ | 38.85 | |||||||||||||||||||||||||||||||||||||||
| Percentage Increase | |||||||||||||||||||||||||||||||||||||||||||||||||||||||||||
| Office Buildings | 4.3 | % | (11.1) | % | (5.1) | % | (8.5) | % | 10.0 | % | (3.9) | % | 0.8 | % | (2.3) | % | 8.8 | % | 5.2 | % | |||||||||||||||||||||||||||||||||||||||
| Retail Centers | — | % | — | % | 12.9 | % | — | % | — | % | (0.1) | % | — | % | — | % | 18.7 | % | 8.2 | % | |||||||||||||||||||||||||||||||||||||||
| Total | 4.3 | % | (11.1) | % | (1.9) | % | (6.9) | % | 8.8 | % | (3.5) | % | 0.8 | % | (2.3) | % | 10.0 | % | 5.6 | % | |||||||||||||||||||||||||||||||||||||||
| Total Dollars | $ per Sq Ft | Total Dollars | $ per Sq Ft | Total Dollars | $ per Sq Ft | Total Dollars | $ per Sq Ft | Total Dollars | $ per Sq Ft | ||||||||||||||||||||||||||||||||||||||||||||||||||
| Tenant Improvements | |||||||||||||||||||||||||||||||||||||||||||||||||||||||||||
| Office Buildings | $ | 465,345 | $ | 16.01 | $ | 297,484 | $ | 31.52 | $ | 895,267 | $ | 46.73 | $ | 1,667,073 | $ | 84.22 | $ | 480,677 | $ | 10.45 | |||||||||||||||||||||||||||||||||||||||
| Retail Centers | — | — | 100,840 | 12.89 | 164,406 | 27.87 | 3,000 | 7.14 | 9,000 | 0.58 | |||||||||||||||||||||||||||||||||||||||||||||||||
| Subtotal | $ | 465,345 | $ | 16.01 | $ | 398,324 | $ | 23.08 | $ | 1,059,673 | $ | 42.29 | $ | 1,670,073 | $ | 82.62 | $ | 489,677 | $ | 7.98 | |||||||||||||||||||||||||||||||||||||||
| Leasing Commissions | |||||||||||||||||||||||||||||||||||||||||||||||||||||||||||
| Office Buildings | $ | 553,522 | $ | 19.04 | $ | 107,674 | $ | 11.41 | $ | 229,690 | $ | 11.99 | $ | 464,719 | $ | 23.48 | $ | 240,732 | $ | 5.24 | |||||||||||||||||||||||||||||||||||||||
| Retail Centers | — | — | 29,586 | 3.78 | 8,665 | 1.47 | 1,338 | 3.19 | 95,055 | 6.18 | |||||||||||||||||||||||||||||||||||||||||||||||||
| Subtotal | $ | 553,522 | $ | 19.04 | $ | 137,260 | $ | 7.95 | $ | 238,355 | $ | 9.51 | $ | 466,057 | $ | 23.06 | $ | 335,787 | $ | 5.47 | |||||||||||||||||||||||||||||||||||||||
| Tenant Improvements and Leasing Commissions | |||||||||||||||||||||||||||||||||||||||||||||||||||||||||||
| Office Buildings | $ | 1,018,867 | $ | 35.05 | $ | 405,158 | $ | 42.93 | $ | 1,124,957 | $ | 58.72 | $ | 2,131,792 | $ | 107.70 | $ | 721,409 | $ | 15.69 | |||||||||||||||||||||||||||||||||||||||
| Retail Centers | — | — | 130,426 | 16.67 | 173,071 | 29.34 | 4,338 | 10.33 | 104,055 | 6.76 | |||||||||||||||||||||||||||||||||||||||||||||||||
| Total | $ | 1,018,867 | $ | 35.05 | $ | 535,584 | $ | 31.03 | $ | 1,298,028 | $ | 51.80 | $ | 2,136,130 | $ | 105.68 | $ | 825,464 | $ | 13.45 | |||||||||||||||||||||||||||||||||||||||
| Commercial Leasing Summary - Renewal Leases | | ||||
| 1st Quarter 2021 | 4th Quarter 2020 | 3rd Quarter 2020 | 2nd Quarter 2020 | 1st Quarter 2020 | |||||||||||||||||||||||||||||||||||||||||||||||||||||||
| Gross Leasing Square Footage | |||||||||||||||||||||||||||||||||||||||||||||||||||||||||||
| Office Buildings | 56,602 | 22,014 | 39,955 | 15,359 | 42,574 | ||||||||||||||||||||||||||||||||||||||||||||||||||||||
| Retail Centers | 68,293 | 3,488 | 7,635 | — | 19,350 | ||||||||||||||||||||||||||||||||||||||||||||||||||||||
| Total | 124,895 | 25,502 | 47,590 | 15,359 | 61,924 | ||||||||||||||||||||||||||||||||||||||||||||||||||||||
| Weighted Average Term (years) | |||||||||||||||||||||||||||||||||||||||||||||||||||||||||||
| Office Buildings | 3.6 | 7.8 | 7.2 | 1.7 | 3.7 | ||||||||||||||||||||||||||||||||||||||||||||||||||||||
| Retail Centers | 5.8 | 3.2 | 1.8 | — | 7.1 | ||||||||||||||||||||||||||||||||||||||||||||||||||||||
| Total | 4.8 | 7.2 | 6.3 | 1.7 | 4.8 | ||||||||||||||||||||||||||||||||||||||||||||||||||||||
| Weighted Average Free Rent Period (months) | |||||||||||||||||||||||||||||||||||||||||||||||||||||||||||
| Office Buildings | 2.1 | 9.0 | 6.9 | 4.5 | 1.2 | ||||||||||||||||||||||||||||||||||||||||||||||||||||||
| Retail Centers | 0.2 | 2.0 | 5.4 | — | 0.1 | ||||||||||||||||||||||||||||||||||||||||||||||||||||||
| Total | 1.5 | 8.2 | 6.7 | 4.5 | 1.0 | ||||||||||||||||||||||||||||||||||||||||||||||||||||||
| Rental Rate Increases: | GAAP | CASH | GAAP | CASH | GAAP | CASH | GAAP | CASH | GAAP | CASH | |||||||||||||||||||||||||||||||||||||||||||||||||
| Rate on expiring leases | |||||||||||||||||||||||||||||||||||||||||||||||||||||||||||
| Office Buildings | $ | 53.64 | $ | 56.24 | $ | 44.93 | $ | 44.89 | $ | 33.30 | $ | 35.00 | $ | 43.93 | $ | 50.65 | $ | 43.46 | $ | 44.70 | |||||||||||||||||||||||||||||||||||||||
| Retail Centers | 19.37 | 21.70 | 40.10 | 41.38 | 35.45 | 39.62 | — | — | 19.88 | 20.96 | |||||||||||||||||||||||||||||||||||||||||||||||||
| Total | $ | 34.91 | $ | 37.36 | $ | 44.27 | $ | 44.41 | $ | 33.65 | $ | 35.74 | $ | 43.93 | $ | 50.65 | $ | 36.09 | $ | 37.28 | |||||||||||||||||||||||||||||||||||||||
| Rate on new leases | |||||||||||||||||||||||||||||||||||||||||||||||||||||||||||
| Office Buildings | $ | 57.45 | $ | 55.64 | $ | 54.70 | $ | 48.45 | $ | 39.15 | $ | 36.18 | $ | 52.44 | $ | 51.62 | $ | 46.39 | $ | 45.00 | |||||||||||||||||||||||||||||||||||||||
| Retail Centers | 21.81 | 21.50 | 41.43 | 41.43 | 41.27 | 40.92 | — | — | 21.73 | 20.64 | |||||||||||||||||||||||||||||||||||||||||||||||||
| Total | $ | 37.96 | $ | 36.97 | $ | 52.89 | $ | 47.49 | $ | 39.49 | $ | 36.94 | $ | 52.44 | $ | 51.62 | $ | 38.69 | $ | 37.39 | |||||||||||||||||||||||||||||||||||||||
| Percentage Increase | |||||||||||||||||||||||||||||||||||||||||||||||||||||||||||
| Office Buildings | 7.1 | % | (1.1) | % | 21.7 | % | 7.9 | % | 17.6 | % | 3.4 | % | 19.4 | % | 1.9 | % | 6.7 | % | 0.7 | % | |||||||||||||||||||||||||||||||||||||||
| Retail Centers | 12.6 | % | (0.9) | % | 3.3 | % | 0.1 | % | 16.4 | % | 3.3 | % | — | % | — | % | 9.3 | % | (1.5) | % | |||||||||||||||||||||||||||||||||||||||
| Total | 8.7 | % | (1.0) | % | 19.5 | % | 6.9 | % | 17.4 | % | 3.4 | % | 19.4 | % | 1.9 | % | 7.2 | % | 0.3 | % | |||||||||||||||||||||||||||||||||||||||
| Total Dollars | $ per Sq Ft | Total Dollars | $ per Sq Ft | Total Dollars | $ per Sq Ft | Total Dollars | $ per Sq Ft | Total Dollars | $ per Sq Ft | ||||||||||||||||||||||||||||||||||||||||||||||||||
| Tenant Improvements | |||||||||||||||||||||||||||||||||||||||||||||||||||||||||||
| Office Buildings | $ | 58,515 | $ | 1.03 | $ | 602,748 | $ | 27.38 | $ | 912,553 | $ | 22.84 | $ | — | $ | — | $ | 79,005 | $ | 1.86 | |||||||||||||||||||||||||||||||||||||||
| Retail Centers | — | — | — | — | — | — | — | — | 125,447 | 6.48 | |||||||||||||||||||||||||||||||||||||||||||||||||
| Subtotal | $ | 58,515 | $ | 0.47 | $ | 602,748 | $ | 23.64 | $ | 912,553 | $ | 19.18 | $ | — | $ | — | $ | 204,452 | $ | 3.30 | |||||||||||||||||||||||||||||||||||||||
| Leasing Commissions | |||||||||||||||||||||||||||||||||||||||||||||||||||||||||||
| Office Buildings | $ | 178,680 | $ | 3.16 | $ | 493,368 | $ | 22.41 | $ | 207,400 | $ | 5.19 | $ | 41,780 | $ | 2.72 | $ | 209,309 | $ | 4.92 | |||||||||||||||||||||||||||||||||||||||
| Retail Centers | 95,252 | 1.39 | 9,482 | 2.72 | — | — | — | — | 34,498 | 1.78 | |||||||||||||||||||||||||||||||||||||||||||||||||
| Subtotal | $ | 273,932 | $ | 2.19 | $ | 502,850 | $ | 19.72 | $ | 207,400 | $ | 4.36 | $ | 41,780 | $ | 2.72 | $ | 243,807 | $ | 3.94 | |||||||||||||||||||||||||||||||||||||||
| Tenant Improvements and Leasing Commissions | |||||||||||||||||||||||||||||||||||||||||||||||||||||||||||
| Office Buildings | $ | 237,195 | $ | 4.19 | $ | 1,096,116 | $ | 49.79 | $ | 1,119,953 | $ | 28.03 | $ | 41,780 | $ | 2.72 | $ | 288,314 | $ | 6.78 | |||||||||||||||||||||||||||||||||||||||
| Retail Centers | 95,252 | 1.39 | 9,482 | 2.72 | — | — | — | — | 159,945 | 8.26 | |||||||||||||||||||||||||||||||||||||||||||||||||
| Total | $ | 332,447 | $ | 2.66 | $ | 1,105,598 | $ | 43.36 | $ | 1,119,953 | $ | 23.54 | $ | 41,780 | $ | 2.72 | $ | 448,259 | $ | 7.24 | |||||||||||||||||||||||||||||||||||||||
10 Largest Tenants - Based on Annualized Commercial Income | | ||||
| March 31, 2021 | |||||
| Tenant | Number of Buildings | Weighted Average Remaining Lease Term in Months | Percentage of Aggregate Portfolio Annualized Commercial Income | Aggregate Rentable Square Feet | Percentage of Aggregate Occupied Square Feet | ||||||||||||||||||||||||
| Atlantic Media, Inc. | 1 | 79 | 6.5 | % | 134,084 | 4.7 | % | ||||||||||||||||||||||
| Capital One, N.A. | 3 | 13 | 4.8 | % | 143,090 | 5.1 | % | ||||||||||||||||||||||
| EIG Management Company, LLC | 1 | 198 | 2.6 | % | 51,358 | 1.8 | % | ||||||||||||||||||||||
| B. Riley Financial, Inc. | 1 | 43 | 2.5 | % | 54,540 | 1.9 | % | ||||||||||||||||||||||
| Hughes Hubbard & Reed LLP | 1 | 143 | 2.4 | % | 47,788 | 1.7 | % | ||||||||||||||||||||||
| Morgan Stanley Smith Barney Financing | 1 | 114 | 2.1 | % | 42,316 | 1.5 | % | ||||||||||||||||||||||
| Promontory Interfinancial Network, LLC | 1 | 68 | 1.9 | % | 36,867 | 1.3 | % | ||||||||||||||||||||||
| Graham Holdings Company | 1 | 44 | 1.8 | % | 33,815 | 1.2 | % | ||||||||||||||||||||||
| Raytheon BBN Technologies Corporation | 1 | 24 | 1.8 | % | 43,277 | 1.5 | % | ||||||||||||||||||||||
Sunrise Senior Living, LLC (1) | 1 | 6 | 1.8 | % | 66,810 | 2.4 | % | ||||||||||||||||||||||
| Total/Weighted Average | 64 | 28.2 | % | 653,945 | 23.1 | % | |||||||||||||||||||||||
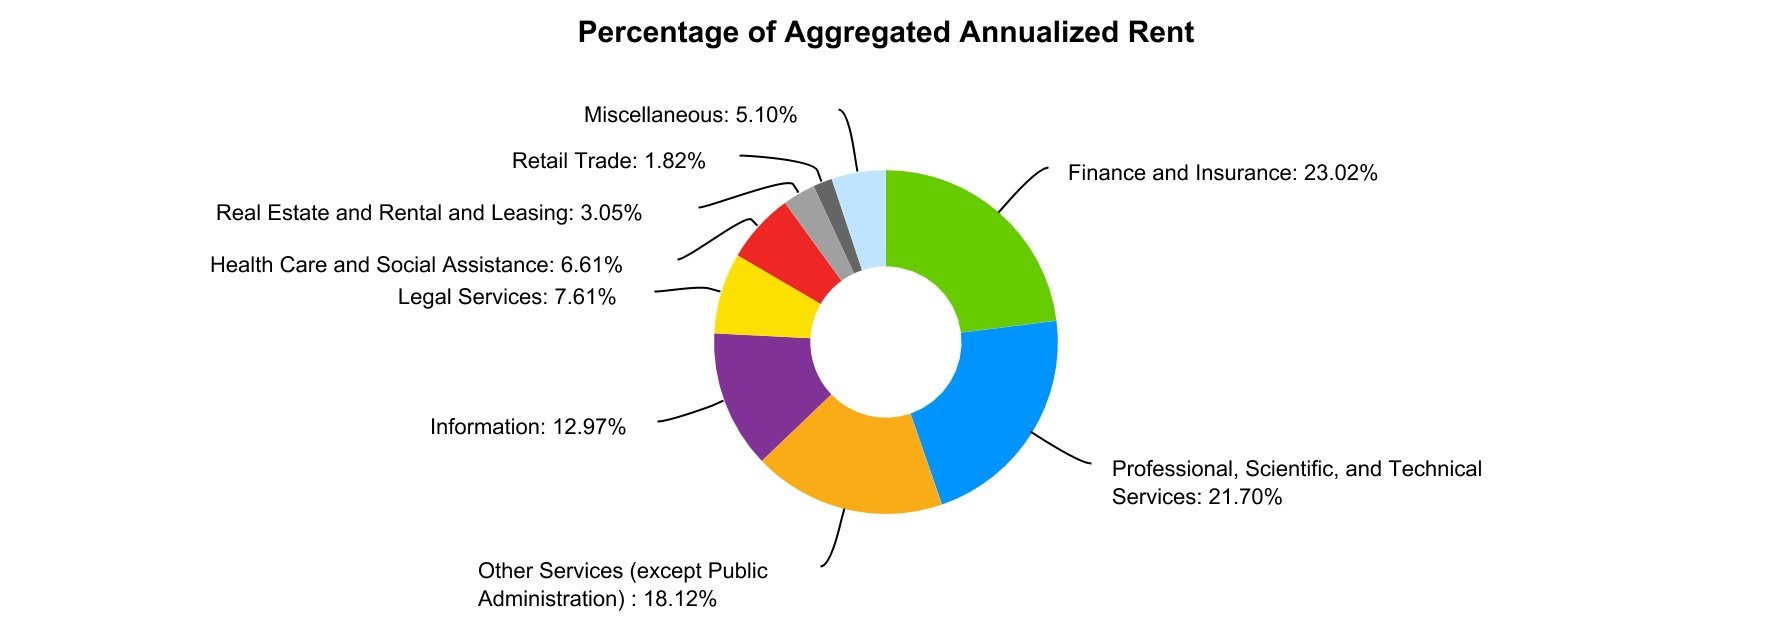
| Industry Diversification - Office | | ||||
| March 31, 2021 | |||||
| Industry Classification (NAICS) | Annualized Base Rental Revenue | Percentage of Aggregate Annualized Rent | Aggregate Rentable Square Feet | Percentage of Aggregate Square Feet | |||||||||||||||||||
| Office: | |||||||||||||||||||||||
| Finance and Insurance | $ | 24,876,022 | 23.02 | % | 462,966 | 21.18 | % | ||||||||||||||||
| Professional, Scientific, and Technical Services | 23,449,510 | 21.70 | % | 505,959 | 23.15 | % | |||||||||||||||||
| Other Services (except Public Administration) | 19,576,921 | 18.12 | % | 387,103 | 17.71 | % | |||||||||||||||||
| Information | 14,012,499 | 12.97 | % | 249,321 | 11.41 | % | |||||||||||||||||
| Legal Services | 8,221,284 | 7.61 | % | 151,926 | 6.95 | % | |||||||||||||||||
| Health Care and Social Assistance | 7,142,064 | 6.61 | % | 179,056 | 8.19 | % | |||||||||||||||||
| Real Estate and Rental and Leasing | 3,294,138 | 3.05 | % | 76,273 | 3.49 | % | |||||||||||||||||
| Retail Trade | 1,962,364 | 1.82 | % | 26,735 | 1.22 | % | |||||||||||||||||
| Miscellaneous: | |||||||||||||||||||||||
| Accommodation and Food Services | 1,744,193 | 1.61 | % | 55,280 | 2.53 | % | |||||||||||||||||
| Transportation and Warehousing | 816,170 | 0.76 | % | 18,306 | 0.84 | % | |||||||||||||||||
| Other | 2,956,417 | 2.73 | % | 72,494 | 3.33 | % | |||||||||||||||||
| Total | $ | 108,051,582 | 100.00 | % | 2,185,419 | 100.00 | % | ||||||||||||||||
Lease Expirations | | ||||
| March 31, 2021 | |||||
| Year | Number of Leases | Rentable Square Feet | Percent of Rentable Square Feet | Annualized Rent (1) | Average Rental Rate | Percent of Annualized Rent (1) | ||||||||||||||||||||||||||||||||
| Office: | ||||||||||||||||||||||||||||||||||||||
2021 (2) | 39 | 180,170 | 8.16 | % | $ | 7,209,106 | $ | 40.01 | 5.76 | % | ||||||||||||||||||||||||||||
| 2022 | 42 | 329,429 | 14.92 | % | 16,028,332 | 48.65 | 12.80 | % | ||||||||||||||||||||||||||||||
| 2023 | 50 | 301,560 | 13.65 | % | 15,058,796 | 49.94 | 12.03 | % | ||||||||||||||||||||||||||||||
| 2024 | 53 | 264,245 | 11.97 | % | 14,458,380 | 54.72 | 11.55 | % | ||||||||||||||||||||||||||||||
| 2025 | 43 | 190,367 | 8.62 | % | 10,569,745 | 55.52 | 8.44 | % | ||||||||||||||||||||||||||||||
| 2026 and thereafter | 115 | 942,685 | 42.68 | % | 61,887,130 | 65.65 | 49.42 | % | ||||||||||||||||||||||||||||||
| 342 | 2,208,456 | 100.00 | % | $ | 125,211,489 | 56.70 | 100.00 | % | ||||||||||||||||||||||||||||||
| Other: | ||||||||||||||||||||||||||||||||||||||
| 2021 | 6 | 18,774 | 3.15 | % | $ | 268,709 | $ | 14.31 | 1.78 | % | ||||||||||||||||||||||||||||
| 2022 | 14 | 75,994 | 12.75 | % | 1,539,860 | 20.26 | 10.19 | % | ||||||||||||||||||||||||||||||
| 2023 | 18 | 39,136 | 6.57 | % | 1,539,896 | 39.35 | 10.19 | % | ||||||||||||||||||||||||||||||
| 2024 | 16 | 151,494 | 25.42 | % | 3,032,893 | 20.02 | 20.08 | % | ||||||||||||||||||||||||||||||
| 2025 | 11 | 79,292 | 13.30 | % | 1,476,234 | 18.62 | 9.77 | % | ||||||||||||||||||||||||||||||
| 2026 and thereafter | 35 | 231,358 | 38.81 | % | 7,248,850 | 31.33 | 47.99 | % | ||||||||||||||||||||||||||||||
| 100 | 596,048 | 100.00 | % | $ | 15,106,442 | 25.34 | 100.00 | % | ||||||||||||||||||||||||||||||
| Total: | ||||||||||||||||||||||||||||||||||||||
| 2021 | 45 | 198,944 | 7.09 | % | $ | 7,477,815 | $ | 37.59 | 5.33 | % | ||||||||||||||||||||||||||||
| 2022 | 56 | 405,423 | 14.46 | % | 17,568,192 | 43.33 | 12.52 | % | ||||||||||||||||||||||||||||||
| 2023 | 68 | 340,696 | 12.15 | % | 16,598,692 | 48.72 | 11.83 | % | ||||||||||||||||||||||||||||||
| 2024 | 69 | 415,739 | 14.82 | % | 17,491,273 | 42.07 | 12.47 | % | ||||||||||||||||||||||||||||||
| 2025 | 54 | 269,659 | 9.62 | % | 12,045,979 | 44.67 | 8.58 | % | ||||||||||||||||||||||||||||||
| 2026 and thereafter | 150 | 1,174,043 | 41.86 | % | 69,135,980 | 58.89 | 49.27 | % | ||||||||||||||||||||||||||||||
| 442 | 2,804,504 | 100.00 | % | $ | 140,317,931 | 50.03 | 100.00 | % | ||||||||||||||||||||||||||||||
______________________________ | ||||||||||||||||||||||||||||||||||||||
(1) Annualized Rent is equal to the rental rate effective at lease expiration (cash basis) multiplied by 12. | ||||||||||||||||||||||||||||||||||||||
(2) Includes 66,810 square feet for Sunrise Senior Living, LLC, which signed an early renewal subsequent to the end of the first quarter of 2021. See slide 25 for further information. | ||||||||||||||||||||||||||||||||||||||
| Note: This table excludes short-term temporary license agreements and office space managed by WashREIT. | ||||||||||||||||||||||||||||||||||||||
Schedule of Properties | | ||||
| March 31, 2021 | |||||
| PROPERTIES | LOCATION | YEAR ACQUIRED | YEAR CONSTRUCTED | # OF UNITS | NET RENTABLE SQUARE FEET | LEASED % (1) | ENDING OCCUPANCY (1) | |||||||||||||||||||||||||||||||||||||
| Multifamily Buildings / # units | ||||||||||||||||||||||||||||||||||||||||||||
| Clayborne | Alexandria, VA | 2003 | 2008 | 74 | 60,000 | 98.6 | % | 97.3 | % | |||||||||||||||||||||||||||||||||||
| Riverside Apartments | Alexandria, VA | 2016 | 1971 | 1,222 | 1,001,000 | 96.6 | % | 95.4 | % | |||||||||||||||||||||||||||||||||||
| Assembly Alexandria | Alexandria, VA | 2019 | 1990 | 532 | 437,000 | 96.8 | % | 95.3 | % | |||||||||||||||||||||||||||||||||||
| Cascade at Landmark | Alexandria, VA | 2019 | 1988 | 277 | 273,000 | 96.8 | % | 96.4 | % | |||||||||||||||||||||||||||||||||||
| Park Adams | Arlington, VA | 1969 | 1959 | 200 | 173,000 | 98.5 | % | 97.5 | % | |||||||||||||||||||||||||||||||||||
| Bennett Park | Arlington, VA | 2001 | 2007 | 224 | 215,000 | 97.3 | % | 96.9 | % | |||||||||||||||||||||||||||||||||||
| The Maxwell | Arlington, VA | 2011 | 2014 | 163 | 116,000 | 98.2 | % | 96.9 | % | |||||||||||||||||||||||||||||||||||
| The Paramount | Arlington, VA | 2013 | 1984 | 135 | 141,000 | 97.8 | % | 94.1 | % | |||||||||||||||||||||||||||||||||||
| The Wellington | Arlington, VA | 2015 | 1960 | 711 | 600,000 | 98.5 | % | 95.8 | % | |||||||||||||||||||||||||||||||||||
| Roosevelt Towers | Falls Church, VA | 1965 | 1964 | 191 | 170,000 | 96.3 | % | 95.8 | % | |||||||||||||||||||||||||||||||||||
| The Ashby at McLean | McLean, VA | 1996 | 1982 | 256 | 274,000 | 99.2 | % | 96.9 | % | |||||||||||||||||||||||||||||||||||
| Assembly Dulles | Herndon, VA | 2019 | 2000 | 328 | 361,000 | 97.0 | % | 94.5 | % | |||||||||||||||||||||||||||||||||||
| Assembly Herndon | Herndon, VA | 2019 | 1991 | 283 | 221,000 | 95.4 | % | 94.3 | % | |||||||||||||||||||||||||||||||||||
| Assembly Manassas | Manassas, VA | 2019 | 1986 | 408 | 390,000 | 95.8 | % | 95.1 | % | |||||||||||||||||||||||||||||||||||
| Assembly Leesburg | Leesburg, VA | 2019 | 1986 | 134 | 124,000 | 98.5 | % | 96.3 | % | |||||||||||||||||||||||||||||||||||
| Bethesda Hill Apartments | Bethesda, MD | 1997 | 1986 | 195 | 225,000 | 95.9 | % | 95.4 | % | |||||||||||||||||||||||||||||||||||
| Assembly Germantown | Germantown, MD | 2019 | 1990 | 218 | 211,000 | 97.2 | % | 95.0 | % | |||||||||||||||||||||||||||||||||||
| Assembly Watkins Mill | Gaithersburg, MD | 2019 | 1975 | 210 | 193,000 | 96.7 | % | 96.7 | % | |||||||||||||||||||||||||||||||||||
| 3801 Connecticut Avenue | Washington, DC | 1963 | 1951 | 307 | 178,000 | 93.5 | % | 87.6 | % | |||||||||||||||||||||||||||||||||||
| Kenmore Apartments | Washington, DC | 2008 | 1948 | 374 | 268,000 | 90.4 | % | 88.8 | % | |||||||||||||||||||||||||||||||||||
| Yale West | Washington, DC | 2014 | 2011 | 216 | 173,000 | 95.8 | % | 95.4 | % | |||||||||||||||||||||||||||||||||||
| Subtotal Stabilized Properties | 6,658 | 5,804,000 | 96.5 | % | 94.9 | % | ||||||||||||||||||||||||||||||||||||||
| Trove | Arlington, VA | 2015 | 2020 | 401 | 293,000 | 46.4 | % | 44.1 | % | |||||||||||||||||||||||||||||||||||
| Subtotal All Properties | 7,059 | 6,097,000 | ||||||||||||||||||||||||||||||||||||||||||
______________________________ | ||||||||||||||||||||||||||||||||||||||||||||
Schedule of Properties (continued) | | ||||
| March 31, 2021 | |||||
| PROPERTIES | LOCATION | YEAR ACQUIRED | YEAR CONSTRUCTED | NET RENTABLE SQUARE FEET | LEASED % (1) | ENDING OCCUPANCY (1) | ||||||||||||||||||||||||||||||||
| Office Buildings | ||||||||||||||||||||||||||||||||||||||
| 515 King Street | Alexandria, VA | 1992 | 1966 | 75,000 | 77.6 | % | 77.6 | % | ||||||||||||||||||||||||||||||
| Courthouse Square | Alexandria, VA | 2000 | 1979 | 121,000 | 82.3 | % | 80.8 | % | ||||||||||||||||||||||||||||||
| 1600 Wilson Boulevard | Arlington, VA | 1997 | 1973 | 171,000 | 87.5 | % | 86.9 | % | ||||||||||||||||||||||||||||||
| Fairgate at Ballston | Arlington, VA | 2012 | 1988 | 144,000 | 78.5 | % | 78.5 | % | ||||||||||||||||||||||||||||||
| Arlington Tower | Arlington, VA | 2018 | 1980/2014 | 389,000 | 84.3 | % | 83.8 | % | ||||||||||||||||||||||||||||||
| Silverline Center | Tysons, VA | 1997 | 1972/1986/1999/2015 | 552,000 | 81.1 | % | 81.1 | % | ||||||||||||||||||||||||||||||
| 1901 Pennsylvania Avenue | Washington, DC | 1977 | 1960 | 101,000 | 77.9 | % | 77.9 | % | ||||||||||||||||||||||||||||||
| 1220 19th Street | Washington, DC | 1995 | 1976 | 103,000 | 86.4 | % | 86.4 | % | ||||||||||||||||||||||||||||||
| 2000 M Street | Washington, DC | 2007 | 1971 | 234,000 | 79.3 | % | 77.2 | % | ||||||||||||||||||||||||||||||
| 1140 Connecticut Avenue | Washington, DC | 2011 | 1966 | 184,000 | 81.6 | % | 81.6 | % | ||||||||||||||||||||||||||||||
| Army Navy Building | Washington, DC | 2014 | 1912/1987/2017 | 108,000 | 97.2 | % | 97.2 | % | ||||||||||||||||||||||||||||||
| 1775 Eye Street, NW | Washington, DC | 2014 | 1964 | 189,000 | 86.5 | % | 86.5 | % | ||||||||||||||||||||||||||||||
| Watergate 600 | Washington, DC | 2017 | 1972/1997 | 295,000 | 88.8 | % | 88.8 | % | ||||||||||||||||||||||||||||||
| Subtotal | 2,666,000 | 83.6 | % | 83.3 | % | |||||||||||||||||||||||||||||||||
______________________________ | ||||||||||||||||||||||||||||||||||||||
Schedule of Properties (continued) | | ||||
| March 31, 2021 | |||||
| PROPERTIES | LOCATION | YEAR ACQUIRED | YEAR CONSTRUCTED | NET RENTABLE SQUARE FEET | LEASED % (1) | ENDING OCCUPANCY (1) | ||||||||||||||||||||||||||||||||
| Retail Centers | ||||||||||||||||||||||||||||||||||||||
| 800 S. Washington Street | Alexandria, VA | 1998/2003 | 1955/1959 | 46,000 | 90.6 | % | 90.6 | % | ||||||||||||||||||||||||||||||
| Concord Centre | Springfield, VA | 1973 | 1960 | 75,000 | 90.2 | % | 90.2 | % | ||||||||||||||||||||||||||||||
| Randolph Shopping Center | Rockville, MD | 2006 | 1972 | 83,000 | 97.4 | % | 86.4 | % | ||||||||||||||||||||||||||||||
| Montrose Shopping Center | Rockville, MD | 2006 | 1970 | 149,000 | 75.8 | % | 75.8 | % | ||||||||||||||||||||||||||||||
| Takoma Park | Takoma Park, MD | 1963 | 1962 | 51,000 | 100.0 | % | 100.0 | % | ||||||||||||||||||||||||||||||
| Westminster | Westminster, MD | 1972 | 1969 | 150,000 | 94.2 | % | 94.2 | % | ||||||||||||||||||||||||||||||
| Chevy Chase Metro Plaza | Washington, DC | 1985 | 1975 | 49,000 | 83.0 | % | 83.0 | % | ||||||||||||||||||||||||||||||
| Spring Valley Village | Washington, DC | 2014 | 1941/1950/2018 | 94,000 | 87.6 | % | 87.6 | % | ||||||||||||||||||||||||||||||
| Subtotal | 697,000 | 88.7 | % | 87.4 | % | |||||||||||||||||||||||||||||||||
| TOTAL PORTFOLIO | 9,460,000 | |||||||||||||||||||||||||||||||||||||
______________________________ | ||||||||||||||||||||||||||||||||||||||
Supplemental Definitions | | ||||
| March 31, 2021 | |||||
Adjusted EBITDA (a non-GAAP measure) is earnings before interest expense, taxes, depreciation, amortization, gain/loss on sale of real estate, casualty gain/loss, real estate impairment, gain/loss on extinguishment of debt, gain/loss on interest rate derivatives, restructuring expenses (which include severance, accelerated share-based compensation and other expenses related to a restructuring of corporate personnel), acquisition expenses and gain from non-disposal activities. | ||
Annualized base rent ("ABR") is calculated as monthly base rent (cash basis) per the lease, as of the reporting period, multiplied by 12. | ||
Average Effective Rent per Unit represents the average of gross rent amounts, divided by the average occupancy (in units) for the period presented. | ||
Average occupancy is based on monthly occupied net rentable square footage as a percentage of total net rentable square footage, except for the rows labeled "Multifamily (calculated on a unit basis)," on which average occupancy is based on average monthly occupied units as a percentage of total units. The square footage for multifamily properties only includes residential space. The occupied square footage for office and retail properties includes temporary lease agreements. | ||
Debt service coverage ratio is computed by dividing earnings attributable to the controlling interest before interest expense, taxes, depreciation, amortization, real estate impairment, gain on sale of real estate, gain/loss on extinguishment of debt, severance expense, relocation expense, acquisition and structuring expenses and gain/loss from non-disposal activities by interest expense (including interest expense from discontinued operations) and principal amortization. | ||
Debt to total market capitalization is total debt divided by the sum of total debt plus the market value of shares outstanding at the end of the period. | ||
Earnings to fixed charges ratio is computed by dividing earnings attributable to the controlling interest by fixed charges. For this purpose, earnings consist of income from continuing operations (or net income if there are no discontinued operations) plus fixed charges, less capitalized interest. Fixed charges consist of interest expense (excluding interest expense from discontinued operations), including amortized costs of debt issuance, plus interest costs capitalized. | ||
Ending Occupancy is calculated as occupied square footage as a percentage of total square footage as of the last day of that period, except Multifamily, on which ending occupancy is calculated as occupied units as a percentage of total available units as of the last day of that period. | ||
NAREIT Funds from operations ("NAREIT FFO") is defined by 2018 National Association of Real Estate Investment Trusts, Inc. (“NAREIT”) FFO White Paper Restatement, as net income (computed in accordance with generally accepted accounting principles (“GAAP”)) excluding gains (or losses) associated with the sale of property, impairment of depreciable real estate and real estate depreciation and amortization. We consider NAREIT FFO to be a standard supplemental measure for equity real estate investment trusts (“REITs”) because it facilitates an understanding of the operating performance of our properties without giving effect to real estate depreciation and amortization, which historically assumes that the value of real estate assets diminishes predictably over time. Since real estate values have instead historically risen or fallen with market conditions, we believe that NAREIT FFO more accurately provides investors an indication of our ability to incur and service debt, make capital expenditures and fund other needs. Our FFO may not be comparable to FFO reported by other real estate investment trusts. These other REITs may not define the term in accordance with the current NAREIT definition or may interpret the current NAREIT definition differently. NAREIT FFO is a non-GAAP measure. | ||
Core Funds From Operations ("Core FFO") is calculated by adjusting NAREIT FFO for the following items (which we believe are not indicative of the performance of Washington REIT’s operating portfolio and affect the comparative measurement of Washington REIT’s operating performance over time): (1) gains or losses on extinguishment of debt and gains or losses on interest rate derivatives, (2) expenses related to acquisition and structuring activities, (3) executive transition costs, severance expenses and other expenses related to corporate restructuring and executive retirements or resignations, (4) property impairments, casualty gains and losses, and gains or losses on sale not already excluded from NAREIT FFO, as appropriate, and (5) relocation expense. These items can vary greatly from period to period, depending upon the volume of our acquisition activity and debt retirements, among other factors. We believe that by excluding these items, Core FFO serves as a useful, supplementary measure of Washington REIT’s ability to incur and service debt, and distribute dividends to its shareholders. Core FFO is a non-GAAP and non-standardized measure, and may be calculated differently by other REITs. | ||
Funds Available for Distribution ("FAD") is calculated by subtracting from NAREIT FFO (1) recurring expenditures, tenant improvements and leasing costs that are capitalized and amortized and are necessary to maintain our properties and revenue stream (excluding items contemplated prior to acquisition or associated with development / redevelopment of a property) and (2) straight line rents, then adding (3) non-real estate depreciation and amortization, (4) non-cash fair value interest expense and (5) amortization of restricted share compensation, then adding or subtracting the (6) amortization of lease intangibles, (7) real estate impairment and (8) non-cash gain/loss on extinguishment of debt, as appropriate. FAD is included herein because we consider it to be a performance measure of a REIT’s ability to incur and service debt and to distribute dividends to its shareholders. FAD is a non-GAAP and non-standardized measure and may be calculated differently by other REITs. | ||
Core Funds Available for Distribution ("Core FAD") is calculated by adjusting FAD for the following items (which we believe are not indicative of the performance of Washington REIT’s operating portfolio and affect the comparative measurement of Washington REIT’s operating performance over time): (1) gains or losses on extinguishment of debt and gains or losses on interest rate derivatives, (2) costs related to the acquisition of properties, (3) non-share-based executive transition costs, severance expenses and other expenses related to corporate restructuring and executive retirements or resignations, (4) property impairments, casualty gains and losses, and gains or losses on sale not already excluded from FAD, as appropriate, and (5) relocation expense. These items can vary greatly from period to period, depending upon the volume of our acquisition activity and debt retirements, among other factors. We believe that by excluding these items, Core FAD serves as a useful, supplementary performance measure of Washington REIT’s ability to incur and service debt, and distribute dividends to its shareholders. Core FAD is a non-GAAP and non-standardized measure, and may be calculated differently by other REITs. | ||
Net Operating Income (“NOI”) is a non-GAAP measure defined as real estate rental revenue less real estate expenses. NOI is calculated as net income, less non-real estate revenue and the results of discontinued operations (including the gain or loss on sale, if any), plus interest expense, depreciation and amortization, general and administrative expenses, acquisition costs, real estate impairment, casualty gains and losses, and gain or loss on extinguishment of debt. We also present NOI on a cash basis ("Cash NOI") which is calculated as NOI less the impact of straightlining of rent and amortization of market intangibles. We provide each of NOI and cash NOI as a supplement to net income calculated in accordance with GAAP. As such, neither should be considered an alternative to net income as an indication of our operating performance. They are the primary performance measures we use to assess the results of our operations at the property level. | ||
Recurring capital expenditures represent non-accretive building improvements and leasing costs required to maintain current revenues. Recurring capital expenditures do not include acquisition capital that was taken into consideration when underwriting the purchase of a building or which are incurred to bring a building up to "operating standard." | ||
Rent increases on renewals and rollovers are calculated as the difference, weighted by square feet, of the net ABR due the first month after a term commencement date and the net ABR due the last month prior to the termination date of the former tenant's term. Beginning in Q4 2018, in cases where the space has been remeasured in accordance with criteria set by the Building Owners and Managers Association ("BOMA"), the square feet former tenant's space is adjusted to be equivalent to the square feet of the new/renewing tenant's space. | ||
Retention represents the percentage of leases renewed that were set to expire in the period presented. | ||
Same-store portfolio properties include properties that were owned for the entirety of the years being compared, and exclude properties under redevelopment or development and properties acquired, sold or classified as held for sale during the years being compared. We define development properties as those for which we have planned or ongoing major construction activities on existing or acquired land pursuant to an authorized development plan. We consider a property's development activities to be complete when the property is ready for its intended use. The property is categorized as same-store when it has been ready for its intended use for the entirety of the years being compared. We define redevelopment properties as those for which have planned or ongoing significant development and construction activities on existing or acquired buildings pursuant to an authorized plan, which has an impact on current operating results, occupancy and the ability to lease space with the intended result of a higher economic return on the property. We categorize a redevelopment property as same-store when redevelopment activities have been complete for the majority of each year being compared. | ||
Same-store portfolio NOI growth is the change in the NOI of the same-store portfolio properties from the prior reporting period to the current reporting period. | ||
Short-term leases are commercial leases with a term of less than 12 months. | ||
Certain statements in our earnings release and on our conference call are "forward-looking statements" within the meaning of the Private Securities Litigation Reform Act of 1995 and involve risks and uncertainties. Forward-looking statements relate to expectations, beliefs, projections, future plans and strategies, anticipated events or trends and similar expressions concerning matters that are not historical facts. In some cases, you can identify forward looking statements by the use of forward-looking terminology such as “may,” “will,” “should,” “expects,” “intends,” “plans,” “anticipates,” “believes,” “estimates,” “predicts,” or “potential” or the negative of these words and phrases or similar words or phrases which are predictions of or indicate future events or trends and which do not relate solely to historical matters. Such statements involve known and unknown risks, uncertainties, and other factors which may cause the actual results, performance, or achievements of WashREIT to be materially different from future results, performance or achievements expressed or implied by such forward-looking statements. Currently, one of the most significant factors continues to be the adverse effect of the COVID-19 virus, including any variants and mutations thereof, the actions taken to contain the pandemic or mitigate the impact of COVID-19, and the direct and indirect economic effects of the pandemic and containment measures. The extent to which COVID-19 continues to impact WashREIT and its tenants will depend on future developments, which are highly uncertain and cannot be predicted with confidence, including the scope, severity and duration of the pandemic, the actions taken to contain the pandemic or mitigate its impact, and the direct and indirect economic effects of the pandemic and containment measures, the continued speed and success of the vaccine rollout, effectiveness and willingness of people to take COVID-19 vaccines, and the duration of associated immunity and their efficacy against emerging variants of COVID-19, among others. Moreover, investors are cautioned to interpret many of the risks identified in the risk factors discussed in our Annual Report on Form 10-K for the year ended December 31, 2020 filed on February 16, 2021, as being heightened as a result of the ongoing and numerous adverse impacts of COVID-19. Additional factors which may cause the actual results, performance, or achievements of WashREIT to be materially different from future results, performance or achievements expressed or implied by such forward-looking statements include, but are not limited to the risks associated with ownership of real estate in general and our real estate assets in particular; the economic health of the greater Washington metro region; the risk of failure to enter into and/or complete potential acquisitions and dispositions, at all, within the price ranges anticipated and on the terms and timing anticipated; changes in the composition of our portfolio; fluctuations in interest rates; reductions in or actual or threatened changes to the timing of federal government spending; the risks related to use of third-party providers; the economic health of our tenants; shifts away from brick and mortar stores to e-commerce; the availability and terms of financing and capital and the general volatility of securities markets; compliance with applicable laws, including those concerning the environment and access by persons with disabilities; the risks related to not having adequate insurance to cover potential losses; the risks related to our organizational structure and limitations of stock ownership; changes in the market value of securities; terrorist attacks or actions and/or cyber-attacks; failure to qualify and maintain our qualification as a REIT and the risks of changes in laws affecting REITs; and other risks and uncertainties detailed from time to time in our filings with the SEC, including our 2020 Form 10-K filed on February 16, 2021. While forward-looking statements reflect our good faith beliefs, they are not guarantees of future performance. We undertake no obligation to update our forward-looking statements or risk factors to reflect new information, future events, or otherwise. | ||